Halloween Approaches While ‘Frankenstorm’ Wreaks Havoc on Auto-Sales Heavy Regions

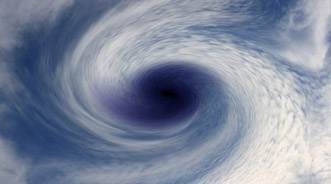
As Hurricane Sandy — or “Frankenstorm” as people have dubbed the pre-Halloween tempest that made landfall in the Northeast just yesterday — ravages the coast the industry waits for news of how it will affect car sales.
News of power outages in Manhattan and serious flooding in New Jersey hits the papers, and the storm continues to cause damage to a region that accounts for about 20 percent of all vehicles sold in the U.S.
Given these developments, Edmunds.com looked at what influence this massive storm will likely have on the final tally for October vehicle sales.
“The storm likely will have an impact on October sales, especially since it comes at the end of the month, but those sales won’t disappear altogether,” explained Edmunds senior analyst Jessica Caldwell.
“If anything, it’ll make November an interesting month to watch, not just for the deferred sales, but also because hurricane-damaged vehicles could unexpectedly force several buyers back into the market,” she added.
To determine which brands are most likely to bear the greatest brunt of the storm, Edmunds used Polk’s car registration data to find which brands are most popular in the hurricane zone — specifically in the New York City, Philadelphia and Washington, D.C. markets.
First, the company stressed that “luxury brands rely on big East Coast markets like these.”
In fact, so far this year, this trio of markets has accounted for 25.4 percent of all Acura sales, 23.6 percent of all Mercedes-Benz sales, 23.2 percent of all BMW sales and 22.6 percent of all Infiniti and Volvo sales.
And what brands may be hit the hardest in the densely populated NYC?
According to Edmunds.com, the most popular brand in New York — which was battling extreme flooding in Lower Manhattan and the Red Hook district of Brooklyn on Tuesday morning — is Honda (14.2 percent of all new car registrations this year).
For Philadelphia, the most popular vehicle is domestic nameplate Ford (14.3 percent); and in D.C., it’s Toyota (16.1 percent).
Edmunds also provided the following spreadsheet that looks at the most popular brands in each of these three affected markets as well as how much each brand relies on them:


 View The Latest Edition

