The San Francisco Giants had won their first of what would be three World Series titles over the next five years.
The iPad was invented. The No. 1 song on Billboard’s year-end Hot 100 was “TiK ToK” by Ke$ha.
The year was 2010.
And within the auto industry, which began to inch forward that year after its historic collapse, it was the last time that certified pre-owned vehicle sales did not break a record.
A decade later, a record-less year in CPO is likely to happen again, as a “TikTok” of a different sort is racing up the charts.
According to the 2020 Market Insights & Outlook report from Cox Automotive, there will likely be 2.0 million CPO sales this year. While still a solid number and considered a bright spot in this year's recovery, that tally would be down from 2.8 million certified sales in 2019 and mark the first year without record CPO sales since 2010, according to Cox Automotive.
“In 2020, the COVID-19 pandemic and recession will hurt CPO sales. A key question will be whether manufacturers support CPO with additional incentives to move the record supply,” the company said in its report.
That supply is fueled by off-lease volumes, which should remain steady at a high level this year after 4.1 million lease returns in 2019 and “should continue to support strong sales of higher-priced ‘gently used’ vehicles and CPO units,” Cox Automotive said.
The company pointed to the fact that CPO vehicles often have 30% to 50% lower prices than the same new models, yet still have many of the top tech amenities.
And despite the projected full-year dip and likely end of the records run, there are certainly some bright spots in CPO, which Cox Automotive manager of economic and industry insights Zo Rahim called an “important part of the used-vehicle market” during a webinar Thursday.
“This is where we've also seen the biggest improvement just last month,” Rahim said.
"CPO sales decreased 6% year-over-year last month, but were up 87% month-over-month," he said. "Sure, the CPO market is small compared to the total used and total new-vehicle markets, but an 87% increase month-over-month is incredibly impressive.
"It's just another sign of the recovery in sales being led by demand,” Rahim said. “Gently used and younger used vehicles should continue to see consumer interest for the rest of the year."
A comprehensive report from iSeeCars.com released earlier this month found there was a 105.5% month-over-month spike in used-vehicle sales for May, with the year-over-year deficit slimming from 38.4% in April to 12.5%.
That same report also found that the used-car gains and losses in May tended to vary among geographic areas, vehicle segments, makes/models and price points.
This story, the second in our series, will focus on used-car sales movements in vehicle segments and makes/models.
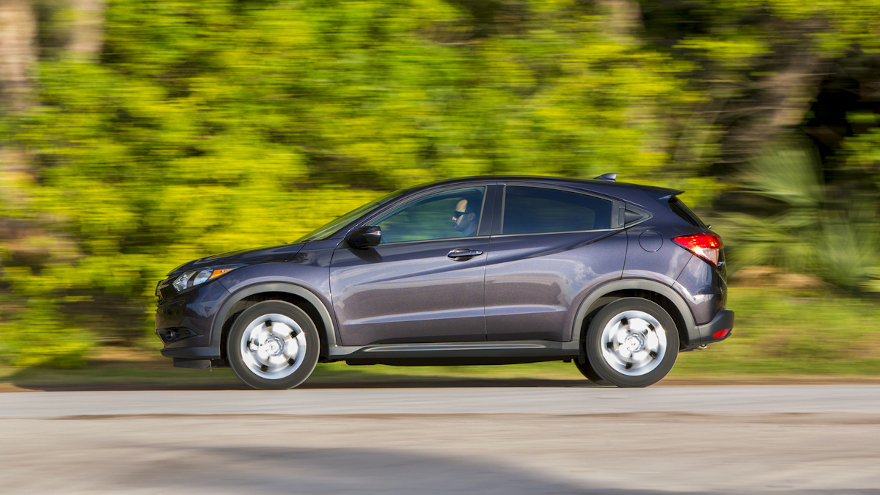
Of the 15 models with the largest year-over-year growth in used-car sales during May, five were pickup trucks and four were subcompact SUVs.
The latter claimed the top spot, as the Honda HR-V subcompact’s used sales were up 53.1% from May 2019.
“The Honda HR-V has been growing in popularity, and 2019 brought its highest new car sales volume since it was introduced in 2016,” iSeeCars chief executive Phong Ly said in the report. “The Honda HR-V beats its competitors in passenger room and fuel efficiency, which helps explain its appeal.”
Fellow subcompact SUV Chevrolet Trax was No. 4 with 23.9% year-over-year growth. The Nissan Rogue Sport was No. 6 with 14.8% growth and No. 13 Buick Encore was up 7.3% year-over-year.
“The subcompact SUV segment has seen year-over-year growth since it debuted as a segment in 2015, and these vehicles appeal to both drivers who want to enter the SUV segment and people looking to downsize from a larger SUV,” said Ly. “The Nissan Rogue Sport debuted in 2017, so 2020 marks the first year many of these vehicles are coming off-lease for the first time.”
Meantime, five pickups dotted the middle and back of the list, starting with the No. 8 Toyota Tacoma, whose used sales were up 13% year-over-year in May. Immediately following was the Ford F-150 with a 12.2% gain.
The Ram 1500 was No. 11 with a 9.0% used sales uptick, while the GMC Sierra 1500 and Chevrolet Silverado 1500 were Nos. 14-15 with 7.3% hikes.
“Pickup trucks continue to grow in popularity, and new pickup truck sales overtook passenger cars in sales for the first time ever in April 2020,” said Ly. “This shows that pickup trucks are popular in the used-car marketplace as well.”
In fact, they were the only body style showing year-over-year improvement in used-car sales during May, according to iSeeCars. Pickup sales were up 9.4% from May 2019, in addition to improving 46.9% from April.
“This suggests that even during the COVID-19 pandemic, there was still a demand for pickup trucks likely for work-related reasons,” Ly said.
Going back to the list of models with the most year-over-year improvement, a smattering of other SUVs outside of the subcompact variety also made the list, including the No. 2 Cadillac XT-5 midsize SUV (up 37.9%) and several others.
As a whole, SUVs had the most moderate year-over-year decline in May (down 6.5) and the strongest improvement from April at 60.8%.
All seven segments in the iSeeCars analysis (convertible, coupe, hatchback, minivan, pickup truck, sedan and SUV) showed double-digit-percentage month-over-month gains in used-car sales during May.
Hatchbacks had the largest year-over-year decline at 26.3%, followed by minivans (19.7%), sedans (18.9%), coupes (9.6%) and convertibles (9.5%).
Below are charts from iSeeCars breaking down year-over-year and month-over-month changes in used-car sales by top make/models and body styles.
All charts and data are courtesy of iSeeCars.
| Used Cars Sales in May 2020, by Bodystyle – iSeeCars Study |
| Bodystyle |
% Change from Last Year |
% Change Over Previous Month |
| Convertible |
-9.5% |
30.3% |
| Coupe |
-9.6% |
18.4% |
| Hatchback |
-26.3% |
44.1% |
| Minivan |
-19.7% |
51.7% |
| Pickup Truck |
9.4% |
46.9% |
| Sedan |
-18.9% |
57.8% |
| SUV |
-6.5% |
60.8% |
The International Automotive Remarketing Alliance (IARA) opened registration for its 2020 IARA Virtual Summer Roundtable, highlighting five unique characteristics of this event on tap for Aug. 20.
According to a news release, the IARA will be offering a virtual expo hall and unique sponsor positioning, opportunities for interactions between attendees, relevant topics and keynote speakers, plus bonus features and materials that will be available to registrants even after the conference is completed.
IARA explained the virtual conference will replace the original event that was scheduled for Aug. 18-20 in San Antonio.
Featured elements of the virtual conference include:
• Two keynote sessions, two roundtable panel discussions, and three simultaneous interactive sessions focusing on key business processes.
• Participation in online chats and the ability to ask questions during sessions.
• Access to contact exhibitors and sponsors via a virtual expo site; download information, schedule an appointment or live chat with representatives.
• Schedule time with other registrants via appointment scheduling.
• Connection to the conference via desktop computer, laptop or even smartphone using the mobile app feature
The keynote speakers for the conference include Blake Stratton, business consultant from Michael Hyatt & Co., who will present a four step-system designed to help individuals grow their businesses as well as Melinda Zabritski, Experian’s senior director of automotive financial solutions, who will examine several key areas of the automotive finance market and discuss how these trends will impact remarketing professionals.
“The industry is hungry for information, and the IARA is primed to provide leadership and content for this very important lifecycle of the remarketing industry,” IARA president Paul Seger said.
The first 200 registrants for the Virtual Conference will receive a show kit that includes added features designed to enhance the virtual experience.
“We’ve had very positive feedback about our recent webinar series, ‘The Road to Recovery,’ but the virtual conference will be a major event that will take us to next level and reflect IARA’s prominence as ‘The Voice of the Consignor,’” IARA executive director Tony Long said.
Registration for the event can be completed here. For more information or to learn more about the IARA, visit IARA.biz.
One of the signature moves by ESPN college football commentator Lee Corso when trying to emphasize a point includes holding up a pencil and telling his colleagues on the TV program, “Not so fast, my friend!”
Well, KAR Global chief economist Tom Kontos did a bit of an impersonation this week when sharing the company’s wholesale price information for May.
According to KAR Global Analytical Services’ monthly analysis of wholesale used-vehicle prices by vehicle model class, wholesale prices in May averaged $11,743, representing a rise of 22.1% compared to April and 0.7% relative to May of last year.
“When looked at on an aggregated basis, wholesale used vehicle prices in May appeared to more than make up for losses in March and April resulting from the COVID-19 pandemic,” Kontos said in his latest installment of the Kontos Kommentary.
“However, with the remarketing industry having undergone significant changes in sales volumes and composition, aggregated numbers often mask lingering weakness in wholesale prices relative to pre-COVID levels that are revealed when disaggregating the data by sale type, model year, model class, etc,” he continued.
“Auctions are selling proportionately more younger, lower-mileage, higher-dollar units, with more sales from commercial consignors than dealer consignors, including more factory and captive finance sales,” Kontos went on to say. “This ‘richer mix’ of vehicles is biasing average prices upward. And sales volumes in May were 75% of year-ago and pre-COVID/February levels, thus representing a more restricted picture of total market conditions.
“Nevertheless, wholesale prices in May did experience a significant rebound and represented a healthy balance between offered supply and dealer demand,” he added.
KAR Global also reported average wholesale prices for used vehicles remarketed by manufacturers in May rose 12.8% month-over-month and up 4.8% year-over-year.
The company said prices for fleet/lease consignors jumped 27.3% sequentially in May but edged 0.1% lower year-over-year.
Finally, KAR Global said average prices in May for dealer consignors climbed 15.3% versus April but declined 3.6% relative to May of last year.
KAR Global also added more information to its regular chart to show pre-COVID-19 metrics.
KAR Global Wholesale Used-Vehicle Price Trends
| |
Average |
Price |
|
($/Unit) |
Latest |
Month |
Versus |
| |
May 2020 |
April 2020 |
February 2020 |
May 2019 |
Prior Month |
Pre-COVID-19 |
Prior Year |
| |
|
|
|
|
|
|
|
| Total All Vehicles |
$11,743 |
$9,621 |
$11,338 |
$11,667 |
22.1% |
3.6% |
0.7% |
| |
|
|
|
|
|
|
|
| Total Cars |
$8,624 |
$6,913 |
$8,360 |
$8,945 |
24.7% |
3.2% |
-3.6% |
| Compact Car |
$6,277 |
$5,221 |
$6,535 |
$6,800 |
20.2% |
-3.9% |
-7.7% |
| Midsize Car |
$7,365 |
$5,880 |
$7,317 |
$7,690 |
25.3% |
0.7% |
-4.2% |
| Full-size Car |
$8,980 |
$7,217 |
$7,765 |
$8,142 |
24.4% |
15.6% |
10.3% |
| Luxury Car |
$13,419 |
$10,699 |
$12.656 |
$13,863 |
25.4% |
6.0% |
-3.2% |
| Sporty Car |
$15,740 |
$12,899 |
$13,874 |
$14,946 |
22.0% |
13.4% |
5.3% |
| |
|
|
|
|
|
|
|
| Total Trucks |
$14,036 |
$11,683 |
$13,529 |
$13,828 |
20.1% |
3.8% |
1.5% |
| Minivan |
$8,735 |
$7,279 |
$8,286 |
$8,581 |
20.0% |
5.4% |
1.8% |
| Full-size Van |
$11,478 |
$8,852 |
$13,176 |
$12,988 |
29.7% |
-12.9% |
-11.6% |
| Compact SUV/CUV |
$11,199 |
$9,661 |
$10,995 |
$11,393 |
15.9% |
1.9% |
-1.7% |
| Midsize SUV/CUV |
$12,606 |
$10,381 |
$12.273 |
$12,199 |
21.4% |
2.7% |
3.3% |
| Full-size SUV/CUV |
$16,725 |
$12,794 |
$16,352 |
$15,482 |
30.7% |
2.3% |
8.0% |
| Luxury SUV/CUV |
$19,624 |
$16,472 |
$18,713 |
$19,381 |
19.1% |
4.9% |
1.3% |
| Compact Pickup |
$11,863 |
$10,299 |
$11,268 |
$11,023 |
15.2% |
5.3% |
7.6% |
| Full-size Pickup |
$17,235 |
$14,618 |
$16,385 |
$17,172 |
17.9% |
5.2% |
0.4% |
Source: KAR Global Analytical Services.
While still much softer than year-ago levels, June’s used-car sales are expected to climb 16% month-over-month, according to the latest forecast from TrueCar subsidiary ALG.
And conditions could improve further in pre-owned, with additional supply on the horizon, financing deals and attractive prices. Plus, the initially heavier impact on used from COVID-19 compared to new may “reverse itself,” says ALG chief industry analyst Eric Lyman.
Overall, ALG is projecting 2,719,074 used-vehicle sales for June. That’s a 20% decline from June 2019 but a 16% uptick from May.
Total new-vehicle sales for the month are forecasted at just under 1.1 million, off 24% year-over-year on a same-selling-days basis.
Taking fleet out, retail new-car sales are expected at 1,014,927, down 15% on a same-selling-days basis. However, it is expected they will climb 1.5% month-over-month.
ALG is forecasting the new-vehicle SAAR at roughly 13 million.
“Automotive retail continues to show positive momentum, rebounding from April lows and performing better than initially expected as states continue to ease restrictions,” Lyman said in a news release. “Fleet is now also beginning to show signs of recovery, up 22% from last month, and we are also seeing significant improvement in the used market, where we expect used-car sales to be up 16% month over month.”
He added: “While used-vehicle sales were initially hit harder than new vehicles due to COVID-19 impact, we expect that trend to reverse itself now due to new car inventory shortfalls.
“Used-vehicle inventory is always much larger than new and lease returns have been picking back up, adding a flood of 2- to 3-year-old vehicles back into the used market,” Lyman said. “Additionally, there’s attractive financing and lower price points which are all helping spur increased demand in the used-vehicle market.”
Looking forward, Cox Automotive said in its Mid-Year Review presentation Thursday that there will likely be a total of 34.1 million used-vehicle sales this year.
Of those, 18.0 million are expected to be what Cox considers to be used retail sales, or sales through a franchised or independent dealer. Certified pre-owned sales are projected at 2.0 million for the year.
Fitch Ratings spotted another place where improving vehicle sales has been good for the automotive industry.
Analysts reported this week that dealer floorplan (DFP) asset backed securities (ABS) trust performance metrics — including monthly payment rates (MPR) — have rebounded on the back of new U.S. auto sales rising in May and early June off of the lows in April, tempering rating pressures entering the historically stronger summer sales season.
However, Fitch Ratings acknowledged that dealers continue to face a challenging operating environment with a rise in coronavirus cases in many parts of the U.S. Analysts noted revenues and profit levels remain suppressed as the new-vehicle seasonally adjusted annual rate (SAAR) is below 13 million units through May.
While the asset performance outlook for the sector is negative, Fitch reiterated that it has not taken any negative ABS rating actions to date, reflecting available credit support and conservative dealer default analysis.
Fitch explained its derived net loss levels for DFP ABS platforms assume more than 50% of dealers default, some of which then resume sales based on ratings and financial metrics such as revenues, profits and absorption rates. This results in modeled dealer default levels of 15 percent to 25 percent for trusts, 10 times to 20 times actual historical dealer defaults.
Analysts noted that there have been no reported defaulted dealers in the ABS trusts to date arising from the coronavirus-related lockdowns across Fitch-rated DFP ABS networks.
“Many dealers across the U.S. remained open for the most part during the pandemic and also moved to online sales to make up for lost foot traffic, which helped to mitigate weakened overall vehicle demand during March and April. Dealer networks also benefitted from government support under the Paycheck Protection Program,” Fitch said in its latest update.
“Dealer networks have received solid support from auto manufacturers and captive lenders, helping to contain credit issues at dealers,” Fitch continued, referencing incentives from captives such as interest-free periods, which drove sales up from less than 10 million new units in April to 12.6 million in May.
Additionally, Fitch mentioned DFP lenders for the most part provided three-month deferrals on capital line interest payments, one of the highest dealer costs, and also deferred curtailment payments, alleviating pressure until the summer when sales and revenues will potentially rebound.
“These helped keep dealer costs down when needed most and have likely supported dealers’ ability to pay down existing debt, benefitting MPRs,” analysts said.
Fitch went on to note the recent new-vehicle sales rebound in May and June and prior production halt resulted in lower inventories, particularly for popular models such as trucks, pickups and SUVs.
Analysts recapped that wholesale used-vehicle values plummeted to around 15% to 20% in March and April, stabilizing in May and improving going into the latter half of June, “positive for dealers as they rely mostly on profits from used sales.”
Analysts then said, “Considering double-digit unemployment, Fitch expects consumers to opt for cheaper, used vehicles during 2020.”
Fitch added trust MPRs declined dramatically in the month of April, but no trust saw MPRs fall below 17%, “showing a high degree of resiliency for the sector, and have started to improve in May.”
Analysts closed by mentioning trusts use MPR performance as a barometer of an issuer’s continuing ability to service and pay notes. Fitch noted MPR early amortization triggers generally look to three-month average MPRs and range from 15% to 30% depending on the trust.
BMW Financial Services and Daimler revised their trust triggers, extending the average range to six months from three months, according to Fitch.
The coronavirus pandemic sabotaged another merger in the financial-services space.
Late Wednesday, Ally Financial and Cardholder Management Services (CardWorks) announced that they have mutually agreed to terminate their merger agreement, which had been first disclosed on Feb. 18.
According to a news release, the board of directors for each company approved the termination after carefully considering the meaningful impacts of COVID-19 on global markets and the economy. Officials said neither party will incur any termination or break-up fees as a result of the mutual decision to terminate the merger agreement.
“Given the unprecedented economic and market conditions resulting from the COVID-19 global pandemic, Don Berman and I, along with our boards of directors, believe it is in the best interests of our customers and stakeholders to terminate the agreement,” Ally chief executive officer Jeffrey Brown said. “This was a difficult decision to make following a long process to bring two strong companies together. I want to express my deep appreciation for the considerable efforts and incredible commitment demonstrated by Ally and CardWorks employees.
“Ally’s long-term strategic priorities remain intact, rooted in a relentless focus on our customers,” Brown continued. “Our industry-leading businesses and robust capital and liquidity positions will enable us to continue serving as a source of strength during these uncertain times for all of our customers. We will leverage these strengths as we grow and diversify our company moving forward. Ally is resilient and adaptable, powered by a vibrant, inclusive culture that will continue to ‘Do It Right’ for our customers, our communities and our shareholders.”
CardWorks is a leading servicer of nationally-branded MasterCard/Visa cards, private label cards, secured cards, and other unique products, as well as secured and unsecured installment loans.
“After careful consideration, Jeff Brown and I, along with our boards of directors, concluded that it would be in the best interest of our customers and our stakeholders, to terminate the agreement,” CardWorks founder, chairman and chief executive officer Don Berman said in a separate news release. “CardWorks has proven through previous recessions to be a great company in difficult times.
“CardWorks is in an exceptionally strong financial position and our long-term strategic priorities remain intact,” Berman continued. “Each of our business lines continues to perform extremely well during these challenging and uncertain times. We have been focused on the well-being of our people and our communities during our entire 32-year history, including through these difficult events of 2020.
“As a private company we are excited to continue to grow our unique business and execute on our long-term strategic initiatives while delighting our clients and customers,” he went on to say.
The situation involving Ally and CardWorks developed similarly to one announced in May involving one of the largest capital providers in the buy-here, pay-here dealership space.
On May 26, Texas Capital Bancshares, the parent company of Texas Capital Bank, announced that Texas Capital Bancshares and Independent Bank Group, the holding company for Independent Bank, mutually agreed to terminate their merger agreement.
Used-vehicle sales jumped 105.5% month-over-month in May and the year-over-year deficit narrowed from 38.4% in April to 12.5% last month, according to a report from iSeeCars.com.
And while the majority of states and major cities were still down year-over-year in May, half of the nation’s 20 largest markets more than doubled their used-car sales from April, with all 50 states climbing month-over-month.
The comprehensive report from iSeeCars examined 3.6 million used-car transactions over those two months, and found that the used-car gains and losses in May tended to vary among vehicle segments, makes/models and price points, according to iSeeCars.
That variance also includes geographic areas, which is where this story will focus.
Starting with the top 20 metropolitan areas in the U.S., just one showed year-over-year used-car sales growth in May: Phoenix, where used-car sales climbed 5.9% from May 2019, the analysis shows.
“Car dealers remained open in Arizona during the state’s stay-at-home order, which ended on May 15,” iSeeCars chief executive Phong Ly said in the report. “This suggests that even though dealers remained open during the pandemic, there was a surge in sales once stay at home orders were lifted.”
Minneapolis-St. Paul had flat used-car sales from a year ago and the remaining 18 largest metros were down.
However, all of the top 20 metro areas showed used sales growth from April, including 10 with triple-digit-percentage growth. The rest showed double-digit gains.
For example, Seattle-Tacoma had the largest month-over-month growth among the top 20 metros at 216.6%, according to the iSeeCars data. Next, used sales in the Philadelphia area were up 205.5% from April.
Expanding the iSeeCars data set to include the 50 largest metro areas, there were nine markets that showed year-over-year growth. No. 1 on that list was St. Louis, where pre-owned sales for the month climbed 9.5% from last May, according to iSeeCars.
San Diego wasn’t far behind at 9.0%.
“Car sales were permitted in Missouri during the pandemic, but St. Louis remained under lockdown even after the state lifted its orders in the beginning of the month due to the number of cases,” said Ly. “This suggests that consumers may have held off on buying cars until the order was lifted in mid-May.”
All of the 50 largest metro areas showed month-over-month growth. The most substantial hike was in the Harrisburg/Lancaster/York area of Pennsylania, where used sales were up 343% from April (but down 23.9% year-over-year).
In a similar analysis, Cross-Sell Interactive looked at combined used- and new-car sales in four major markets: New York, Chicago, Detroit and Houston.
Detroit climbed a whopping 537.8% month-over-month in combined used and new sales for May, according to Cross-Sell, with New York jumping 219.5%, Houston up 161.1% and Chicago improving 69.0%.
“Most dealers are probably breathing a sigh of relief to see these increases, but automotive isn’t entirely out of the woods yet,” Cross-Sell said in this analysis. “The U.S. as a whole is down 33.9% compared to a year ago. With lingering concern about the pandemic and many states reopening – many buyers will still be hesitant to return to market.”
State-by-state growth trends
The iSeeCars analysis also included a state-by-state breakdown in used-car sales growth/decline.
On a year-over-year basis, eight states showed growth in May, led by Hawaii’s 40.0% increase.
Iowa (up 7.9%) was next, followed by Idaho (6.7%), Alaska (6.6%), Utah (5.7%) and Arizona (4.2%).
Arkansas (up 3.9%) and Missouri (up 2.2%) also improved from May 2019.
“The state with the greatest increase is Hawaii, which saw significant growth in May 2020 over the previous year,” said Ly. “The state had the largest year-over-year difference in average price, with cars bought in May 2020 on average 13.5% cheaper than cars bought in 2019, which suggests that more consumers are buying used cars amid the downturn and taking advantage of low prices.”
The most significant year-over-year declines in May were in Vermont (down 31.8%), Nevada (30.4%), New Jersey (29.8%), California (26.9%) and Michigan (26%).
Of Vermont, Ly said: “Although May sales doubled over the previous month, the state’s historic unemployment rate likely kept consumers from buying cars.”
After Michigan, the state with the next-highest decline was Pennsylvania, where used sales were off 25.2%. However, it had the strongest month-over-month growth at 227.5%.
Similarly, Washington (which was middle of the pack in terms of year-over-year change) was down 6.0% from May 2019, but its sales jumped 199.5% from April.
Put differently, used-car sales in these two states essentially tripled from April to May.
“Pennsylvania had strict orders to ban car sales until online sales were allowed in late April,” said Ly. “Washington was among the first areas to have a stay-at-home order, and auto dealers were under strict restrictions before opening in early May.”
All 50 states showed at least double-digit-percentage growth in used-car sales from April to May, the iSeeCars data shows.
In addition to Washington and Pennsylvania, 13 other states showed show triple-digit-percentage growth in used sales from April.
Below are charts from iSeeCars breaking down year-over-year and month-over-month changes in used-car sales among the top 20 metro areas, the top 50 metro areas and the 50 stats. All charts and data courtesy of iSeeCars.
| Used Car Sales in Top 20 Metro Areas, May 2020 – iSeeCars Study |
| Rank |
Metro Area |
% Change from Last Year |
% Change from Previous Month |
| 1 |
Phoenix, AZ |
5.9% |
61.7% |
| 2 |
Minneapolis-St. Paul, MN |
0.0% |
92.4% |
| 3 |
Orlando-Daytona Beach, FL |
-2.8% |
79.3% |
| 4 |
Tampa-St Petersburg (Sarasota), FL |
-6.4% |
74.2% |
| 5 |
Seattle-Tacoma, WA |
-7.8% |
216.6% |
| 6 |
Dallas-Ft. Worth, TX |
-9.0% |
69.8% |
| 7 |
Chicago, IL |
-9.1% |
93.5% |
| 8 |
Denver, CO |
-9.9% |
106.8% |
| 9 |
Houston, TX |
-9.9% |
54.3% |
| 10 |
Boston, MA-Manchester, NH |
-11.4% |
110.9% |
| 11 |
Atlanta, GA |
-12.2% |
89.1% |
| 12 |
Cleveland-Akron (Canton), OH |
-14.8% |
61.7% |
| 13 |
Washington, DC (Hagerstown, MD) |
-15.5% |
105.4% |
| 14 |
Detroit, MI |
-18.6% |
177.1% |
| 15 |
Miami-Ft. Lauderdale, FL |
-19.6% |
108.0% |
| 16 |
Sacramento-Stockton-Modesto, CA |
-24.7% |
63.3% |
| 17 |
New York, NY |
-28.6% |
179.2% |
| 18 |
Los Angeles, CA |
-31.3% |
118.7% |
| 19 |
Philadelphia, PA |
-31.8% |
205.5% |
| 20 |
San Francisco-Oakland-San Jose, CA |
-35.1% |
101.9% |
| Overall Average |
-12.5% |
105.5% |
| Used Car Sales in Top 50 Metro Areas, May 2020 – iSeeCars Study |
| Rank |
Metro Area |
% Change from Last Year |
% Change from Previous Month |
| 1 |
St. Louis, MO |
9.5% |
66.1% |
| 2 |
San Diego, CA |
9.0% |
114.2% |
| 3 |
Phoenix, AZ |
5.9% |
61.7% |
| 4 |
Portland, OR |
4.7% |
92.2% |
| 5 |
Cincinnati, OH |
3.6% |
91.4% |
| 6 |
San Antonio, TX |
2.8% |
75.1% |
| 7 |
Baltimore, MD |
0.9% |
92.8% |
| 8 |
Indianapolis, IN |
0.5% |
64.1% |
| 9 |
Salt Lake City, UT |
0.1% |
51.9% |
| 10 |
Minneapolis-St. Paul, MN |
0.0% |
92.4% |
| 11 |
Austin, TX |
-0.2% |
71.7% |
| 12 |
Norfolk-Portsmouth-Newport News,VA |
-0.5% |
90.2% |
| 13 |
Raleigh-Durham (Fayetteville), NC |
-2.0% |
65.4% |
| 14 |
Orlando-Daytona Beach, FL |
-2.8% |
79.3% |
| 15 |
Oklahoma City, OK |
-5.5% |
43.1% |
| 16 |
Tampa-St Petersburg (Sarasota), FL |
-6.4% |
74.2% |
| 17 |
Columbus, OH |
-6.4% |
64.2% |
| 18 |
Kansas City, MO |
-7.5% |
91.7% |
| 19 |
Seattle-Tacoma, WA |
-7.8% |
216.6% |
| 20 |
Birmingham, AL |
-8.5% |
68.5% |
| 21 |
Dallas-Ft. Worth, TX |
-9.0% |
69.8% |
| 22 |
Chicago, IL |
-9.1% |
93.5% |
| 23 |
Denver, CO |
-9.9% |
106.8% |
| 24 |
Greenville-Spartanburg, SC |
-9.9% |
60.0% |
| 25 |
Houston, TX |
-9.9% |
54.3% |
| 26 |
Boston, MA-Manchester, NH |
-11.4% |
110.9% |
| 27 |
Atlanta, GA |
-12.2% |
89.1% |
| 28 |
Pittsburgh, PA |
-13.4% |
103.2% |
| 29 |
West Palm Beach-Ft. Pierce, FL |
-14.1% |
78.7% |
| 30 |
Nashville, TN |
-14.1% |
64.2% |
| 31 |
Greensboro-Winston Salem, NC |
-14.5% |
77.5% |
| 32 |
Cleveland-Akron (Canton), OH |
-14.8% |
61.7% |
| 33 |
Milwaukee, WI |
-14.8% |
55.4% |
| 34 |
Washington, DC (Hagerstown, MD) |
-15.5% |
105.4% |
| 35 |
Jacksonville, FL |
-15.6% |
55.3% |
| 36 |
Charlotte, NC |
-17.8% |
73.5% |
| 37 |
Detroit, MI |
-18.6% |
177.1% |
| 38 |
Miami-Ft. Lauderdale, FL |
-19.6% |
108.0% |
| 39 |
Memphis, TN |
-20.2% |
49.7% |
| 40 |
Albuquerque-Santa Fe, NM |
-20.3% |
103.6% |
| 41 |
Fresno-Visalia, CA |
-21.0% |
63.0% |
| 42 |
Hartford & New Haven, CT |
-22.0% |
107.1% |
| 43 |
Grand Rapids-Kalamazoo, MI |
-23.0% |
174.2% |
| 44 |
Harrisburg-Lancaster-York, PA |
-23.9% |
343.0% |
| 45 |
Sacramento-Stockton-Modesto, CA |
-24.7% |
63.3% |
| 46 |
New York, NY |
-28.6% |
179.2% |
| 47 |
Los Angeles, CA |
-31.3% |
118.7% |
| 48 |
Philadelphia, PA |
-31.8% |
205.5% |
| 49 |
Las Vegas, NV |
-32.3% |
96.0% |
| 50 |
San Francisco-Oakland-San Jose, CA |
-35.1% |
101.9% |
| Overall Average |
-12.5% |
105.5% |
| Used Car Sales by State in May 2020 – iSeeCars Study |
| Rank |
State |
% Change from Last Year |
% Change from Previous Month |
| 1 |
Hawaii |
40.0% |
122.6% |
| 2 |
Iowa |
7.9% |
55.9% |
| 3 |
Idaho |
6.7% |
79.1% |
| 4 |
Alaska |
6.6% |
91.2% |
| 5 |
Utah |
5.7% |
52.4% |
| 6 |
Arizona |
4.2% |
63.0% |
| 7 |
Arkansas |
3.9% |
45.9% |
| 8 |
Missouri |
2.2% |
76.8% |
| 9 |
South Dakota |
-0.3% |
73.9% |
| 10 |
Oklahoma |
-1.2% |
40.3% |
| 11 |
Montana |
-1.5% |
58.6% |
| 12 |
Oregon |
-1.8% |
78.3% |
| 13 |
Maine |
-3.5% |
117.7% |
| 14 |
West Virginia |
-3.7% |
73.3% |
| 15 |
Nebraska |
-3.7% |
67.4% |
| 16 |
Indiana |
-3.7% |
65.8% |
| 17 |
Texas |
-4.9% |
67.3% |
| 18 |
Minnesota |
-5.4% |
92.1% |
| 19 |
Virginia |
-5.5% |
96.1% |
| 20 |
North Dakota |
-5.6% |
85.6% |
| 21 |
Washington |
-6.0% |
199.5% |
| 22 |
Kentucky |
-7.6% |
113.9% |
| 23 |
Delaware |
-7.7% |
102.7% |
| 24 |
Louisiana |
-8.5% |
82.9% |
| 25 |
Alabama |
-8.6% |
61.8% |
| 26 |
Massachusetts |
-8.7% |
151.9% |
| 27 |
Wisconsin |
-9.2% |
69.7% |
| 28 |
Kansas |
-10.0% |
71.5% |
| 29 |
Colorado |
-10.3% |
109.2% |
| 30 |
Georgia |
-11.6% |
81.4% |
| 31 |
Florida |
-11.7% |
80.8% |
| 32 |
New Hampshire |
-12.8% |
43.4% |
| 33 |
North Carolina |
-13.3% |
70.3% |
| 34 |
Ohio |
-13.4% |
65.8% |
| 35 |
South Carolina |
-13.6% |
62.9% |
| 36 |
Illinois |
-14.7% |
91.2% |
| 37 |
Maryland |
-15.3% |
96.6% |
| 38 |
Tennessee |
-15.7% |
60.6% |
| 39 |
Mississippi |
-15.9% |
40.5% |
| 40 |
Wyoming |
-17.1% |
63.0% |
| 41 |
New Mexico |
-17.6% |
101.6% |
| 42 |
Rhode Island |
-21.3% |
89.8% |
| 43 |
Connecticut |
-24.3% |
114.6% |
| 44 |
New York |
-24.5% |
165.2% |
| 45 |
Pennsylvania |
-25.2% |
227.5% |
| 46 |
Michigan |
-26.0% |
192.2% |
| 47 |
California |
-26.9% |
101.7% |
| 48 |
New Jersey |
-29.8% |
175.0% |
| 49 |
Nevada |
-30.4% |
93.7% |
| 50 |
Vermont |
-31.8% |
101.4% |
| Overall Average |
-12.5% |
105.5% |
George Augustaitis, who is director of automotive industry and economic analysis at CarGurus, joins the Auto Remarketing Podcast to talk about how the automotive and economic impact from COVID-19 is different than other crises.
He also talks about the used-car market ups and downs around supply and demand, auction trends and pricing.
Plus, Augustaitis discusses how used-car sales recovery may differ among among vehicle age groups.
To listen to this episode, click on the link available below, or visit the Auto Remarketing Podcast page.
Download and subscribe to the Auto Remarketing Podcast on iTunes or on Google Play.
Black Book analysts made the connection of how federal stimulus payments and enhanced unemployment benefits given during April and May combined with limited used-vehicle inventory combined to create the highest weekly appreciation “in recent history.”
According to Black Book’s newest COVID-19 Market Update released on Tuesday, overall car and truck segments values both generated gains for the fourth week in a row, increasing 1.27% overall.
Black Book’s volume-weighted pricing information for both cars and trucks revealed value hikes last week much higher than a week earlier. Analysts said overall car segments increased by 1.54% (compared to 0.88% the prior week) and the overall trucks and SUV segments increased again this past week at 1.11% (compared to 0.52% during the prior week).
Specific vehicle segments generating the highest value increases included compact cars (up 2.29%) and small pickups (up 2.89%).
“Both the small pickup and compact car segments experienced very large depreciations at the onset of the pandemic but have been consistent in the rebounding of prices week after week,” analysts said in the latest update.
“Minivans also had a second week of increasing prices at 2% after 11 consecutive weeks of declines,” Black Book added.
Despite the value increases, Black Book described auction activity this past week as “on fire” with high conversion rates and high sale prices.
“Most no-sales this past week were the result of sellers holding firm to floors and not due to a lack of demand by the buyers. As a result, buyers are having to pay top dollar to secure quality inventory,” analysts said.
Meanwhile, Black Book highlighted that dealers are enjoying strong used-vehicle sales overall so far this month. However, the success of retailing those used vehicles is creating problems for managers in finding replenishment inventory.
“The lack of repossessions, delayed lease returns and staffing limitations at the auctions are all contributing to low inventory levels at the auctions,” analysts said. “The estimation is that it will be at least two more weeks before we start to see an increase at many auctions around the country.”
Black Book then addressed what could be a path of quality used-vehicle inventory — rental risk units. But just like so many other business tasks during the coronavirus pandemic, getting those vehicles through the wholesale industry is easier said than done.
“Although we see some recovery in rental demand (outside of airport business), we measured a substantial increase (compared to previous weeks and compared to last year) in volume of rental units sold, as rental fleet companies are beginning to de-fleet and reduce their fleets to match much weaker consumer and business traveler demand,” Black Book said.
“As the supply continues to grow, we are concerned with the throughput at major auctions as they continue to operate with reduced staff,” analysts continued. “In our continuous conversations with management teams from major auction chains, they report that they are trying to execute on the increased volume and customer demand without immediately bringing back significant amounts of furloughed staff.
“There is a concern that this uptick may be short-lived and the need for increased staff may be temporary,” Black Book added.