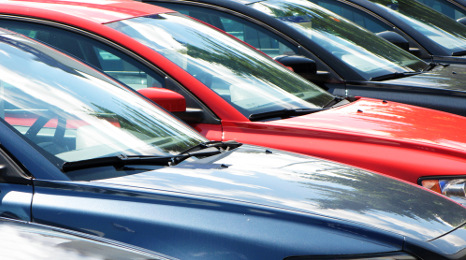
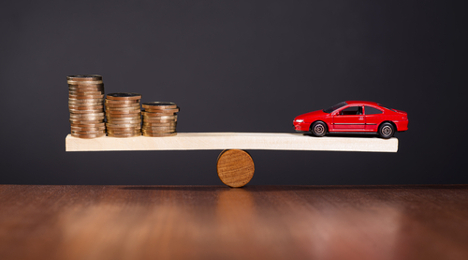
In what could be an ominous development for the used-vehicle department down the road, J.D. Power and LMC Automotive indicated that they have never seen franchised dealers slap as much cash on the hood as they are seeing this month to keep new metal turning.
Analysts reported on Monday that incentive spending thus far in September is at a record level of $3,923 per unit. That figure surpassed the previous high of $3,753 set in December 2008.
Despite that activity, J.D. Power and LMC Automotive projected that for the fifth time in the past seven months, U.S. new-vehicle retail sales are expected to drop in September, falling 1.4 percent from a year ago.
Retail sales are on pace to reach 1,185,500 units in September, while total sales are projected to fall 0.8 percent to 1,429,100.
Labor Day weekend is typically one of the highest volume sales weekends in the year. Analysts noted the weekend’s sales this September were 199,493 units, a 1 percent decrease compared with 2015. This decline was despite elevated incentive programs from manufacturers.
“The industry can be viewed through two competing perspectives,” said Deirdre Borrego, senior vice president and general manager of automotive data and analytics at J.D. Power.
The first is that in absolute terms, the industry is performing at an exceptional level,” Borrego said. “While sales have fallen slightly, they are at near-record levels and transaction prices are at all-time highs.
“The second is less positive. With the rate of growth slowing, leading indicators are pointing to challenges ahead. Specifically in September, incentive spending is at an all-time high,” Borrego went on to say.
J.D. Power and LMC Automotive noted that retail sales year to date through September are expected to be down 1.3 percent, compared with the same period in 2015, while total sales are expected to be up 0.5 percent.
“The U.S. automotive market continues to show signs of little growth, yet in our opinion the numbers do not reflect a significant weakness or risk, said Jeff Schuster, senior vice president of forecasting at LMC Automotive.
“The expectation remains for steady volume levels at the topline, despite a pullback in the retail market and increased monthly performance volatility,” Schuster continued. “However, group and brand performance is beginning to diverge as competitive pressure is at an all-time high.”
Also of note for the used-vehicle industry, J.D. Power and LMC Automotive predicted fleet sales would reach 243,600 in September, a 2.1 percent increase from September of last year. That figure would account for 17.0 percent of total light-vehicle sales.
With leasing activity continuing to intensify, a quartet of experts from Moody’s Analytics devised elaborate formulas and explanations for how to structure residual values that might help captive finance companies, other institutions that provide vehicle leasing as well as other service providers involved with remarketing.
The Moody’s team introduce a new model for forecasting the residual values of vehicles at the 11-digit VIN level under a variety of macroeconomic scenarios.
“We illustrate the plausibility of model forecasts under varying degrees of vehicle usage over multiple time horizons as well as with respect to different macroeconomic scenarios and car features,” the group said in a white paper titled, “Introducing AutoCycle: Residual Risk Management and Lease Pricing at the VIN Level.”
The analysts explained that they discussed and illustrated two additional features, including:
— The ability to calculate exact vehicle values at a given quantile of inferred vehicle quality (for example, the value of a 2013 Honda Accord at the 80th percentile of quality sold in March 2016, conditional on macroeconomic drivers and the car’s observed features)
— The ability to generate forecasts of residual values for vehicle in model years that have not yet come on the market (for example, the residual value of a 2019 Honda Accord sold in July 2022)
“Our model can be used for residual risk management in large lease and auto portfolios as well as for pricing leases on individual vehicles themselves,” said the Moody’s team, which included:
— Tony Hughes, managing director of research
— Samuel Malone, a director in the specialized modeling group
— Michael Brisson, an economist at Moody’s Analytics
— Michael Vogan, an economist in the credit analytics department at Moody’s Analytics
The complete white paper can be downloaded here.
It was the same story, different week for vehicle values — sort of.
“Last week, the depreciation rate on car segments accelerated to the highest level in the year, while truck segments, including pickups and SUVs, continue to show strength,” Anil Goyal, senior vice president of automotive valuation and analytics for Black Book, said in the most recent Market Insights report.
Volume weighted, overall car segment prices (model years 2008-2014) decreased by 0.62 percent last week, slightly higher than the average depreciation rate of 0.44 percent seen in the previous four weeks. For the segment as a whole, vehicle values were down an average of $71.
Midsize car, near-luxury car and prestige luxury car segments declined the most, by 0.74 percent, 0.92 percent and 0.93 percent, respectively.
Meanwhile, volume-weighted, overall truck segment values decreased by 0.29 percent last week, similar to the average depreciation rate of 0.32 percent seen in the previous four weeks. For the segment as a whole, vehicles values were down an average of $47.
Compact van and subcompact crossover segments declined the most, by 1.36 percent and 1.12 percent, respectively.
Representatives from Black Book go out into the auction lanes throughout the U.S. each week. Below are some of their most recent observations:
“The market trend at this location is slow, but full-size trucks are still in demand,” said a lane watcher in Tennessee. “Dealers state that the slow retail business is due to the heat.”
Heat did not seem to be an issue in Nevada, where a watcher noted that “buyers were aggressive today, with many dealers buying to fill slots in their inventory.”
Late-summer vacations appear to have played a role in Pennsylvania, where Black Book personnel noted: “There was a slight slowdown in retail last week due to vacations before school started back, but dealers were buying well today.”
Elsewhere in the Keystone State: “Slow sale today per several dealers.”
Meanwhile, a Black Book rep in Texas noted: “A fairly steady auction today but many no-sales.”
Finally, in Michigan, “Retail is a bit soft here, but bidding has been very active just the same.”
What happened in July
According to Black Book data, the average price of a used vehicle for model years 2011-2015 depreciated by 1.5 percent in July, slightly better than June’s 1.7 percent and similar to monthly depreciation rates seen in the past three Julys: 1.4 percent in 2015, 2.1 percent in 2014 and 1.3 percent in 2013.
Vehicles in July averaged a 12-month depreciation change of 15.4 percent, the same as June and at the lower end of the range seen prior to the recession, Black Book said. Across all segments, the average vehicle price at the end of July was $15,893, down from $18,784 a year ago.
Cars overall depreciated by 1.9 percent in July. Car prices finished the month at an average of $12,677, down from $15,487 a year ago.
Trucks, meanwhile, finished at 1.2 percent for July. Truck prices finished the month at an average of $20,121, down from $23,119 a year ago.
Luxury cars saw the highest depreciation in July at 2.5 percent, finishing the month with an average price of $22,883, down from last year’s $29,251.
In addition to luxury cars, five other segments saw an increase in depreciation by 2.0 percent or greater in July: compact luxury cars (2.3 percent), midsize cars (2.2 percent), prestige luxury cars (2.1 percent), subcompact cars (2.1 percent) and full-size cars (2.0 percent).
Full-size crossovers saw the strongest retention during July at 0.5 percent, finishing the month with an average price of $28,739, down from last year’s $31,780.
Full-size vans (0.7 percent) were the only other segment with a depreciation rate of less than 1.0 percent on the month.
“Although we saw depreciation trends last month that was consistent with typical seasonal valuation patterns this month, many segments showed slightly better retention heading into the deeper summer months,” Goyal said. “Depreciation for all segments will likely worsen as fall nears and demand for certain segments continues to dwindle.”
Fitch Ratings took another look at the impact rising wholesale supply is having.
This week, analysts explained U.S. auto lease ABS residual performance is still producing gains overall through mid-summer despite rising used-vehicle supplies. However, Fitch indicated further increases in vehicle supply during the second half of this year and into 2017 could lead to pressure on residual values.
Fitch’s quarterly residual value ABS index slowly declined during the past year. The index recorded a residual value gain of 2.51 percent as of the second quarter of this year, down from 4.79 percent in Q2 2015 and 8.39 percent at Q2 2014.
Analysts noted the average yearly gain in 2014 was 5.75 percent, which then slowed to 3.97 percent in 2015 and averaged 2.10 percent for the first half of this year. They also highlighted the peak residual value gain was 29.21 percent observed in Q1 2011.
Fitch’s outlook for auto lease ABS asset performance remains stable for the second half of this year, supported by continual growing credit enhancement levels resulting in healthy levels of loss protection.
Analysts explained the persistent residual value gains, “albeit at a lower level,” are partially due to the conservative establishment of securitized residuals in U.S. auto lease transactions.
Securitized residuals in U.S. auto lease ABS are often defined as the lesser of residual values established by the servicer at lease inception, Automotive Lease Guide’s (ALG) value at inception, or ALG’s mark-to-market value at the time of the transaction's closing.
By securitizing the lowest of these and comparing that value to lease-end sales prices in determining a residual value loss or gain, there is built-in residual value loss protection, according to Fitch
The firm went on to mention that it expects the pace of upgrades to subordinate notes to continue for auto lease ABS in the second half of this year.
Upgrades are driven in large part to delevering transaction structures and growing credit enhancement levels. Further, Fitch’s base case or “BBsf” residual value loss proxy is conservatively determined by isolating only the residual value losses an issuer observed during the worst 12-18 month period, typically during the weakest 2008-2009 period.
Analysts went on to say additional “haircuts” are employed as rating categories increase. This usually amounts to roughly 28 percent to 32 percent in loss protection as a percentage of returned residuals for “AAAsf” ratings, providing “ample” support, according to analysts.
“Even if residual values continue to decline throughout the remainder of 2016 and into early 2017, loss levels would have to be magnified above those levels to have an impact on outstanding transactions,” Fitch said.
“Used-vehicle volumes entering the secondary market increased significantly due to strong lease originations in recent years,” the firm continued. “This led to higher supply of off-lease vehicles and trade-in volumes.
“Higher fleet and rental volumes entering the secondary market have also pressured residual performance,” Fitch went on to say.
Fitch’s auto lease residual value ABS index also tracks the amount of lease maturities and return volumes.
The index recorded nearly $6.9 billion in returns (securitized residual value amount) in 2015, up from $5.8 billion in 2014. In the first half of 2016, the index posted $3.7 billion in return vehicles, with $4.7 billion more expected in the second half, totaling more than $8.4 billion. This figure represents a 22-percent jump in returns this year versus 2015.
“The used vehicle market saw a shift in consumer preferences in recent years,” analysts said. “With sustained low gas prices and increased fuel efficiency, used vehicle prices for trucks, SUVs/CUVs and vans continue to outperform smaller cars. The full-line category is also outperforming luxury.”
Luxury issuers account for approximately a third of residual returns in Fitch’s Index and have averaged 0.45 percent in residual losses in the first half of this year compared with 2.95 percent in residual gains for full line.
Fitch's auto lease residual value index tracks the performance of 39 U.S. outstanding auto lease transactions totaling $28.4 billion of collateral as of June, issued from 12 auto lease ABS platforms with data dating back to January 2007.
RVI Group analysts noticed more than half of the 19 vehicle segments they track for the Market Update posted a month-over-month increase in residual values during June.
Leading this group with a rise of 1.9 percent were two vehicle segments that can get a lot of work during the summertime — full-size pickups and sports cars. Not far off that pace, RVI Group put the month-over-month residual uptick for minivans at 1.8 percent and luxury coupes at 1.6 percent.
Overall, RVI Group noticed used-vehicle prices increased in June.
The RVI Used Vehicle Price Index (Real) increased by 0.3 percent in June when compared to May. When compared to June of last year, the index fell by 3.5 percent.
RVI’s Used Vehicle Price Index (Nominal) increased by 0.5 percent in June when compared to May. When compared to last June, the index decreased by 1.6 percent.
RVI Group also mentioned in its latest Market Update that new-vehicle prices softened by 0.4 percent year-over-year in June. Analysts added that new-model transaction prices on a seasonally adjusted basis ticked 0.1 percent lower in June on a sequential basis.
Finally, while recapping data from the U.S. Department of Energy, RVI Group pointed out that June gas prices jumped 4.1 percent compared to the previous month. But looking at pump prices year-over-year, the price of gas is 14.5 percent lower.
RVI Group’s Rene Abdalah will again be a part of the National Remarketing Conference at Used Car Week, adding to a panel discussion about wholesale prices. Used Car Week begins Nov. 14 at the Red Rock Resort and Casino in Las Vegas.
Black Book unveiled its May residual forecast on Monday, illustrating the downward pressure on prices that increased supply will continue to have over the next few years.
Black Book forecast data showed that residuals on an average 3-year-old vehicle will dip from the current three-year retention of 52.0 percent in 2016, to 47.8 percent by 2019.
Analysts recapped that retention values on a 3-year-old vehicle peaked in 2013 when vehicles were retaining approximately 54.5 percent of their original typically-equipped retail. Black Book pointed out that favorable credit availability, continued growth in demand and consistently low gas prices have provided support in keeping retention rates high in the last five years.
Analysts added that increased used supply in the marketplace, driven by the significantly large volume of sales on new cars and trucks, has played a driving role in slipping retention rates this year.
Here are the historical three-year retention rates and the projected residual forecast on an average 3-year-old vehicle according to Black Book:
2012: 53.8 percent
2013: 54.5 percent
2014: 54.3 percent
2015: 54.1 percent
2016: 52.0 percent
2017: 50.1 percent (forecast)
2018: 48.6 percent (forecast)
2019: 47.8 percent (forecast)
The historical data represents published Black Book Wholesale Average values as a percent of new typically-equipped retail. The forecast represents published Black Book Residual Values averaged across all 3-year-old models.
“Despite the industry’s continued efforts to maintain a strong pace of sales on new cars and trucks, the increased level of supply in the used market has begun to weaken prices on both cars and trucks,” said Anil Goyal, Black Book’s senior vice president of automotive valuation and analytics.
“We saw the first sign of this in 2015, when cars saw above-average depreciation on the year, and this year we will see rising depreciation for truck segments as well,” Goyal continued.
When it comes to holding their values, Acura and Toyota have earned top billing yet again.
The two brands won the luxury and mainstream categories, respectively, in the Edmunds.com Best Retained Value Awards, which the firm released on Thursday.
The awards are based on the 2016 model-year vehicles with the highest projected residual values after five years. Acura has won the top luxury spot for five years in a row, and Toyota has taken home top non-luxury honors two years in a row.
Toyota vehicles were projected to hold onto 53.8 percent of their value after five years, with Acura maintaining 47.6 percent.
There are also 24 segment-level category winners, of which Toyota won five. Honda, Lexus and Mercedes-Benz each won three.
“It’s no secret that a new car starts depreciating the moment that you drive it off the lot, but car shoppers owe it to themselves to understand exactly how much they can expect their cars to depreciate over time,” Edmunds.com consumer advice editor Carroll Lachnit said in a news release.
“If shoppers are deciding between competing models, we advise them to see if any of the cars on their list earned a Best Retained Value Award. This one simple step could bring them more money down the road when it’s finally time to trade in or sell the car,” Lachnit said.
A full list of winnners can be found here: www.edmunds.com/car-reviews/best-retained-value-cars.html.
Subaru and Ford are on top of two loyalty rankings released by Experian Automotive on Tuesday, while the ranking of individual model loyalty was dominated by luxury vehicles.
According to Experian’s analysis of roughly 6.8 million household repurchases that put pen to paper between October 2014 and September 2015, Subaru and Ford ranked highest, first and second, respectively, in both brand loyalty and manufacturer loyalty.
Looking at individual models, Land Rover’s Range Rover was the model with the most repeat buyers (48.2 percent).
As an overall manufacturer, Toyota ranked third-highest in customer loyalty — but on a brand level, Mercedes-Benz was the third-highest overall in brand loyalty while also ranking first in the luxury brand rankings.
“It’s exciting to see that manufacturers’ efforts to improve owner loyalty are working,” said Brad Smith, director of automotive statistics and consulting at Experian. “Over the last few years, loyalty rates have increased, and these improvements are key to the industry. Understanding rates of consumer loyalty among vehicle brands, makes and models helps to drive better business decisions, such as a dealer selecting inventory and targeting advertising or a manufacturer making adjustments to a vehicle’s design and creating more competitive promotional strategies.”
Here are the top 10 loyalty rankings for each metric, provided by Experian:
Manufacturer Loyalty Top 10
| Manufacturer |
Loyalty Rate (%) |
| Subaru |
67.7 |
| Ford |
67.5 |
| Toyota |
67.3 |
| General Motors |
67.2 |
| Fiat Chrysler |
65.5 |
| Daimler |
64.9 |
| Kia |
63.2 |
| Honda |
61.3 |
| Hyundai |
61.3 |
| Nissan |
61.2 |
Overall Brand Loyalty Top 10
| Brand |
Loyalty Rate (%) |
| Subaru |
67.7 |
| Ford |
66.7 |
| Mercedes-Benz |
65.1 |
| Toyota |
63.5 |
| Kia |
63.2 |
| Hyundai |
61.3 |
| Nissan |
61.1 |
| Chevrolet |
60.7 |
| Lexus |
60.7 |
| Honda |
59.9 |
Luxury Brand Loyalty Top 10
| Brand |
Loyalty Rate (%) |
| Mercedes-Benz |
65.1 |
| Lexus |
60.7 |
| BMW |
57.4 |
| Porsche |
57.2 |
| Lincoln |
57 |
| Audi |
54.7 |
| Land Rover |
51.6 |
| Cadillac |
49.2 |
| Infiniti |
45.7 |
| Acura |
43.8 |
Model Loyalty Top 10
| Model |
Loyalty Rate (%) |
| Land Rover Range Rover |
48.2 |
| Mercedes-Benz S Class |
46.6 |
| Lincoln MKZ |
44.8 |
| Mercedes-Benz 2500 Sprinter Van |
44.8 |
| Nissan Leaf |
44 |
| Ram 1500 |
42.9 |
| Lexus RX 350 |
42.7 |
| Hyundai Genesis |
42.5 |
| Kia Soul |
42 |
| Subaru Forester |
41.1 |
Some other interesting facts found by Experian’s study include the following:
- North Dakota is the state with the most brand-loyal customers (67.2 percent), followed by Michigan (66.4 percent) and Iowa (65.8).
- 69 percent of lease customers stayed loyal to their brands during the timeframe of Experian’s study, followed by 56.9 percent of consumers with loans.
- Customers who finances with manufacturer captive finance companies (Ford Credit, Toyota Financial, etc.) were more loyal (63.8 percent purchased same brand again) compared to customers with independent bank loans (58 percent).
Citing historical trends, NADA Used Car Guide points out that November saw an easing in used-vehicle depreciation, staying the course for the typical seasonal pattern of the industry. November’s depreciation – 1.9 percent – was noticeably lower than October’s 2.7-percent drop.
In the December edition of Guidelines, NADA UCG’s seasonally adjusted used-vehicle price index rose 1 percent compared to last month, to 123.8. Year-to-date, the index falls just 0.2 percent shy of the index’s all-time high averaged last year.
"It's normal for used-vehicle depreciation to slow during the end of the year,” Jonathan Banks, NADA UCG’s executive analyst, said in the analysis. “That said, while the slow is normal for the month, it was steeper than last November's 1-percent slide."
Diving a bit deeper, compact cars saw the biggest hit last month, falling by an industry high 2.7 percent in November, continuing its trend of dropping roughly 3 percent each month for the last seven.
While depreciation for the industry, as a whole, stood at 13.2 percent YTD at the end of November (compared to 12.7 percent for 2014), let’s take a look at all of the segments’ price drops last month, according to NADA UCG:
Change in Wholesale Used-Vehicle Prices – Oct. vs. Nov. 2015
| Segment |
Price Drop Percentage (all values negative) |
| Compact Car |
(2.7) |
| Large Car |
(2.3)
|
| Subcompact Car |
(2.1) |
| Luxury Mid-Size Car |
(2.1) |
| Luxury Compact Car |
(2.0) |
| Industry Average |
(1.9) |
| Mid-Size Van |
(1.9) |
| Luxury Mid-Size Utility |
(1.7) |
| Luxury Compact Utility |
(1.6) |
| Large Pickup |
(1.6) |
| Mid-Size Utility |
(1.6) |
| Compact Utility |
(1.4) |
| Mid-Size Car |
(1.4) |
| Mid-Size Pickup |
(1.1) |
| Luxury Large Car |
(1.1) |
| Large SUV |
(0.8) |
Year-to-date auction volume, by the end of November, stood at 3.83 million units, up 4 percent compared to the same period last year.
Looking forward, NADA UCG predicts that the prices for used vehicles aged zero to 8 years will fall roughly 1 percent in December compared to November. Zooming in to the segment level, the organization also predicts that subcompact and compact cars will drop by 1 percent, more than any other mainstream segment, while both luxury cars and utilities are expected to lose 1 to 1.5 percent in December.
January prices are expected to remain flat before increasing approximately 0.5 percent in February.
When it comes to a vehicle’s retained value from new to used, volume is important — but selling more of a vehicle doesn’t necessarily imply its value will stay. Even if the product is spectacular, perceived quality and new quantity sold do not go hand in hand.
This is one lesson that Subaru and Lexus have apparently learned, as both were today named by Kelley Blue Book for the latter’s 2016 Best Resale Value Award winners for best brand and best luxury brand, respectively.
Auto Remarketing chatted with Eric Ibara, KBB’s director of residual values, to see why.
“I guess the simple answer would be that they make great vehicles that people want. There are a lot of brands that make great cars,” Ibara said. “I think what we’ve learned is that making great cars is not sufficient. You also need to manage the way in which vehicles are marketed and sold. And what these brands do very well, I think, is they match their production with the market demands.
“They don’t overproduce the vehicles, and they’re also marketing the vehicles in a way that enhances the value of the vehicles. So they’re not discounting their vehicles to get more volume.”
KBB's 2016 Best Resale Value: Top 10 Cars
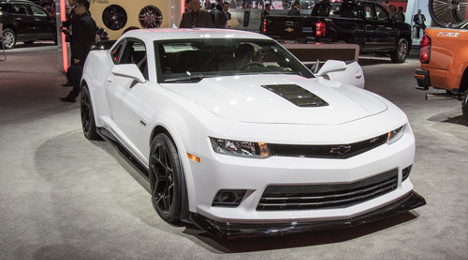
| Chevrolet Camaro |
Subaru Forester |
| Chevrolet Colorado |
Subaru WRX |
| GMC Canyon |
Toyota 4Runner |
| GMC Sierra |
Toyota Tacoma |
| Jeep Wrangler |
Toyota Tundra |
And if you take a look at the top-10 list of vehicles from the 2016 model year that KBB expects to retain the highest percentage of their sticker values, you probably won’t be surprised that eight out of the 10 are trucks or utility vehicles. What may surprise you, however, is that five of the vehicles expected to depreciate the least are from domestic automakers.
With four of those five being manufactured by General Motors, we asked Ibara if he was surprised.
“I think that people could be surprised by that. You don’t normally think of domestic brands when you think of vehicles that retain their value,” he said. “But I think that ever since GM went through bankruptcy they really have changed the way in which they approach the market. I sense, and I see, that they’re doing a better job of matching production to demand. They’re not overproducing vehicles and they’ve cut back on the volume of vehicles that they send into daily rental.
“I think these are all good signs but I guess, first and foremost, they’re making vehicles that are very appealing when you see the vehicles that have come to market over the last few years, like the Tahoe and like the Canyon and Colorado,” he continued. “You can see that the vehicles are much improved over what they’ve offered in the past.”
Those with a keen eye that follow KBB’s resale values will notice a first-time inclusion on the list: Tesla.
Ibara says that used-car transaction data for Tesla, up until recent times, was a bit hard to come by. But now that the situation has been rectified, as Ibara put it, KBB is noticing that Tesla’s Model S isn’t seeing as hard a hit in the used market as the rest of the electric vehicle segment is currently experiencing.
“The electric vehicle segment is very interesting,” Ibara said. “We are seeing EVs depreciate much faster than their gasoline-engine counterparts, where one exists. We think it’s a function of the federal tax credit that all these vehicles qualify for and we also think that the early adopters who are buying the electric vehicles want a new car. We don’t see a lot of early adopters gravitating toward used electric vehicles and as a result their depreciation is very steep, for the most part. The Model S is an exception to this rule.”
So what’s a “safe” segment to invest in, as a used-vehicle dealer? KBB expects for trucks and sport utility vehicles to remain popular for years to come — a trend that Ibara says started before oil prices dropped the favorable level they are today.
“We think it’s a trend that will be around for a while,” he said. “Oil is trading around $35 a barrel right now, and there’s really no sign that it’s going to end that streak any time soon. We’re thinking that consumers will continue to prefer sport utility vehicles and that will make them more desirable five years down the road.”
Here's the full list of KBB's 2016 Best Resale Value Awards by vehicle category:
KBB's 2016 Best Resale Value: By Vehicle Category
| SUBCOMPACT CAR: Honda Fit |
PLUG-IN VEHICLE: Tesla Model S |
| COMPACT CAR: Subaru Impreza |
COMPACT SUV/CROSSOVER: Jeep Wrangler |
| SPORTY COMPACT CAR: Subaru WRX |
MID-SIZE SUV/CROSSOVER: Toyota 4Runner |
| MID-SIZE CAR: Subaru Legacy |
FULL-SIZE SUV/CROSSOVER: Chevrolet Tahoe |
| FULL-SIZE CAR: Toyota Avalon |
LUXURY COMPACT SUV/CROSSOVER: Porsche Macan |
| ENTRY-LEVEL LUXURY CAR: Lexus RC |
LUXURY MID-SIZE SUV/CROSSOVER: Lexus GX 460 |
| LUXURY CAR: Lexus GS |
LUXURY FULL-SIZE SUV/CROSSOVER: Lexus LX 570 |
| HIGH-END LUXURY CAR: Porsche Panamera |
HYBRID SUV/CROSSOVER: Lexus RX 450h |
| SPORTS CAR: Chevrolet Camaro LT |
MID-SIZE PICKUP TRUCK: Toyota Tacoma |
| HIGH PERFORMANCE CAR: Chevrolet Camaro SS |
FULL-SIZE PICKUP TRUCK: Toyota Tundra |
| HYBRID/ALTERNATIVE ENERGY CAR: Lexus ES 300h |
MINIVAN/VAN: Toyota Sienna |