Two wholesale market trends are continuing to gain momentum, according to the latest Black Book Market Insights report.
Analysts pinpointed the momentum’s source: Dealers are passing on a growing number of vehicles in the lanes, and it's pressuring prices to soften.
“Values of car and truck segments declined at a similar rate last week. The no-sale rate at auto auctions continues to be high as buyers push down prices,” Black Book executive vice president of operations Anil Goyal said in the latest report.
Based on volume-weighted data, Black Book determined overall car segment values decreased by 0.53% last week. That’s slightly higher than the four-week average of 0.48%.
Analysts noticed values of sub-compact cars declined the most, sliding by 1.08% or $62.
Again according to volume-weighted information, Black Book indicated overall truck segment values (including pickups, SUVs, and vans) dropped by the same amounts as cars last week — 0.53%. That’s also a bit above the four-week average in the truck space of 0.41%
In the truck arena, analysts spotted values of small pickups decreasing the most, dropping by 1.23% or $200.
Furthermore, anecdotes from Black Book representatives stationed at nearly 60 sales nationwide reinforced how analysts arrived at the overall price movements. The rundown includes:
— From Illinois: “Overall, the volume of vehicles consigned at the auction was good, and the lower priced vehicles sold OK.”
— From Indiana: “Lots of buyers looking to buy at discount. Nice vehicles and trucks remain scarce.”
— From Florida: “The captive financial vehicles sold well, but everything else was a challenge, especially the dealer consigned vehicles.”
— From Georgia: “Values continue to come down as no-sales go up.”
Trucks and SUVs are designed to carry a variety of things, from flea market finds to raw materials for countless projects.
And apparently those units carried overall wholesale price movements in September, too.
According to KAR Global Analytical Services’ monthly analysis of wholesale used-vehicle prices by vehicle model class, overall prices in September averaged $11,155. That figure is 0.8% lower compared to August but 1.6% higher relative to September of last year.
“Average wholesale prices in September fell relative to August but remained up on a year-over-year basis,” KAR Global chief economist Tom Kontos said. “The year-over-year price growth was again due to the strength and growing share of truck-segment sales, as car prices fell on a monthly and annual basis.
“Declines on both a month-over-month and year-over-year basis were concentrated in the car segments,” he continued in the latest edition of the Kontos Kommentary released late on Friday afternoon.
As he regularly does, Kontos examined late-model midsize sedans as well as midsize CUV/SUVs. He found that when holding constant for sale type, model-year age, mileage and model class segment — using criteria that characterize off-lease units — prices were fairly flat on a year-over-year basis for both midsize cars and midsize SUV/CUVs.
Prices for those particular cars softened by $57 or 0.5% year-over-year in September to settle at $12,241, while prices for those specific SUV/CUVs ticked up $82 or 0.4% to $20,717.
Looking at other segments of the September data, Kontos also mentioned average wholesale prices for used vehicles remarketed by manufacturers were down 3.5% month-over-month but up 3.6% year-over-year.
He noted prices for fleet/lease consignors dropped 1.6% sequentially but rose 0.9% annually.
Kontos went on to point out average prices for dealer consignors dropped 2.4% versus August and 1.9% relative to September of last year.
ADESA Wholesale Used-Vehicle Price Trends
| |
Average |
Price |
($/Unit) |
Latest |
Month Versus |
| |
September 2019 |
August 2019 |
September 2018 |
Prior Month |
Prior Year |
| |
|
|
|
|
|
| Total All Vehicles |
$11,155 |
$11,244 |
$10,981 |
-0.8% |
1.6% |
| |
|
|
|
|
|
| Total Cars |
$8,356 |
$8,465 |
$8,617 |
-1.3% |
-3.0% |
| Compact Car |
$6,403 |
$6,530 |
$6,533 |
-1.9% |
-2.0% |
| Midsize Car |
$7,231 |
$7,312 |
$7,491 |
-1.1% |
-3.5% |
| Full-size Car |
$7,667 |
$7,592 |
$7,655 |
1.0% |
0.2% |
| Luxury Car |
$12,934 |
$13,080 |
$13,380 |
-1.1% |
-3.3% |
| Sporty Car |
$14,137 |
$14,219 |
$14,327 |
-0.6% |
-1.3% |
| |
|
|
|
|
|
| Total Trucks |
$13,272 |
$13,382 |
$12,949 |
-0.8% |
2.5% |
| Minivan |
$8,197 |
$8,118 |
$8,314 |
1.0% |
-1.4% |
| Full-size Van |
$13,934 |
$13,748 |
$13,365 |
1.4% |
4.3% |
| Compact SUV/CUV |
$10,990 |
$10,923 |
$10,781 |
0.6% |
1.9% |
| Midsize SUV/CUV |
$11,717 |
$11,548 |
$11,144 |
1.5% |
5.1% |
| Full-size SUV/CUV |
$14,381 |
$14,248 |
$13,941 |
0.9% |
3.2% |
| Luxury SUV/CUV |
$18,358 |
$18,465 |
$18,285 |
-0.6% |
0.4% |
| Compact Pickup |
$11,083 |
$11,080 |
$9,981 |
0.0% |
11.0% |
| Full-size Pickup |
$16,528 |
$17,061 |
$16,317 |
-3.1% |
1.3% |
Source: ADESA Analytical Services.
Late-model vehicles are continuing to depreciate annually at a little more than 1% per month, according to the latest Black Book data.
Analysts reported this week that the average price of a used vehicle for model years 2013 through 2017 decreased in value by 1.0% during September, with cars softening by 1.1% and trucks dipping by 1.0%.
Black Book computed that all vehicles in this age segment are averaging a 12-month depreciation reading of 13.9%.
Analysts noticed the only vehicle segment that saw a positive change during September was the sub-compact crossover, which edged up by 0.4%. One segment finished the month with just a 0.1% decline: full-size luxury CUV/SUV.
Vehicles in the sub-compact crossover segment include the Jeep Renegade, Mazda CX-3, Nissan Rogue, Buick Encore and Honda HRV.
Models in the Full-Size Luxury CUV/SUV segment include the BMW X7, Audi Q7, Lexus LX 470, Mercedes-Benz G-Class and Toyota Land Cruiser.
On the opposite end of the spectrum, Black Book determined two segments finished with the highest monthly depreciation. They included compact vans (down 2.2%) and luxury cars (down 1.9%).
Units in the compact van segment include the Chevrolet City Express, Ford Transit Connect, Mercedes-Benz Metris, Nissan NV, Ram C/V, and Ram ProMaster City.
Vehicles in the luxury car segment include the Acura RLX, Audi A7, BM 5-Series, Cadillac CT6, Lexus GS 350, Mercedes-Benz E-Class and the Volvo S90.
“September has come in strong in the last couple of years. However, the values were softer in the month this year, consistent with previous seasonality trends,” Black Book executive vice president of operations Anil Goyal said.
“The used-vehicle values could see a steeper decline in Q4 if the demand slows as inventories on both new and used vehicles remain high,” Goyal went on to say.
|
|
10/1/18
|
9/1/19
|
1-Month Change
|
10/1/19
|
3-Month Change
|
12-Month
Change
|
|
SUMMARY
|
|
|
|
|
|
|
|
All Vehicles
|
$18,425
|
$16,034
|
-1.0%
|
$15,871
|
-2.3%
|
-13.9%
|
|
Car
|
$14,568
|
$12,408
|
-1.1%
|
$12,269
|
-2.8%
|
-15.8%
|
|
Truck
|
$21,754
|
$19,163
|
-1.0%
|
$18,979
|
-2.0%
|
-12.8%
|
|
Domestic Car
|
$13,961
|
$11,937
|
-1.4%
|
$11,766
|
-2.9%
|
-15.7%
|
|
Domestic Truck
|
$22,106
|
$19,856
|
-0.8%
|
$19,695
|
-1.4%
|
-10.9%
|
|
Import Car
|
$14,866
|
$12,640
|
-1.0%
|
$12,516
|
-2.8%
|
-15.8%
|
|
Import Truck
|
$21,244
|
$18,159
|
-1.2%
|
$17,941
|
-2.9%
|
-15.5%
|
|
|
|
|
|
|
|
|
|
SEGMENTS
|
|
|
|
|
|
|
|
Compact Car
|
$10,563
|
$9,052
|
-1.0%
|
$8,961
|
-2.3%
|
-15.2%
|
|
Full-Size Car
|
$16,924
|
$14,877
|
-1.1%
|
$14,708
|
-2.0%
|
-13.1%
|
|
Luxury Car
|
$26,342
|
$20,759
|
-1.9%
|
$20,358
|
-4.8%
|
-22.7%
|
|
Mid-Size Car
|
$12,643
|
$11,003
|
-1.4%
|
$10,849
|
-3.2%
|
-14.2%
|
|
Near Luxury Car
|
$19,484
|
$16,063
|
-0.4%
|
$15,997
|
-1.9%
|
-17.9%
|
|
Premium Sporty Car
|
$42,569
|
$36,887
|
-1.0%
|
$36,524
|
-3.2%
|
-14.2%
|
|
Prestige Luxury Car
|
$42,523
|
$33,241
|
-1.3%
|
$32,812
|
-5.0%
|
-22.8%
|
|
Sporty Car
|
$16,234
|
$14,465
|
-1.3%
|
$14,279
|
-2.8%
|
-12.0%
|
|
Sub-Compact Car
|
$8,673
|
$7,463
|
-1.0%
|
$7,387
|
-2.6%
|
-14.8%
|
|
Compact Crossover/SUV
|
$15,682
|
$13,781
|
-1.0%
|
$13,638
|
-1.7%
|
-13.0%
|
|
Compact Luxury CUV/SUV
|
$25,180
|
$20,473
|
-1.3%
|
$20,204
|
-4.0%
|
-19.8%
|
|
Compact Van
|
$13,427
|
$11,940
|
-2.2%
|
$11,681
|
-3.3%
|
-13.0%
|
|
Full-Size Crossover/SUV
|
$32,193
|
$28,597
|
-0.1%
|
$28,575
|
-0.7%
|
-11.2%
|
|
Full-Size Luxury CUV/SUV
|
$43,193
|
$35,508
|
-1.4%
|
$35,006
|
-4.2%
|
-19.0%
|
|
Full-Size Pickup
|
$27,772
|
$26,018
|
-1.1%
|
$25724
|
-1.6%
|
-7.4%
|
|
Full-Size Van
|
$18,450
|
$17,521
|
-0.4%
|
$17,453
|
-0.7%
|
-5.4%
|
|
Mid-Size Crossover/SUV
|
$19,815
|
$17,125
|
-0.7%
|
$17,005
|
-1.8%
|
-14.2%
|
|
Mid-Size Luxury CUV/SUV
|
$28,767
|
$23,368
|
-1.4%
|
$23,044
|
-3.7%
|
-19.9%
|
|
Minivan
|
$17,517
|
$15,112
|
-1.5%
|
$14,891
|
-3.2%
|
-15.0%
|
|
Small Pickup
|
$24,586
|
$22,423
|
-1.4%
|
$22,107
|
-2.4%
|
-10.1%
|
|
Sub-Compact Crossover
|
$13,160
|
$11,297
|
+0.4%
|
$11,347
|
-1.2%
|
-13.8%
|
|
Sub-Compact Luxury CUV
|
$18,875
|
$15,427
|
-0.9%
|
$15,287
|
-3.5%
|
-19.0%
|
Source: Black Book
Dealers appear to be hesitant to hit the buy button online or raise their hand in the lanes, and wholesale values are reflecting the behavior.
Analysts arrived at those conclusions and shared more in the latest Black Book Market Insights report that mentioned values softening at higher levels than seen during the previous four weeks.
“Values continued to slide at a faster rate last week with most vehicle segments experiencing larger drops. Higher no-sales were also reported at the auto auctions,” Black Book executive vice president of operations Anil Goyal said in the latest report.
Volume-weighted, analysts found that overall car segment values decreased by 0.51% last week. In comparison, Black Book noted the previous four-week average represented a decline of 0.39%.
Among cars, analysts discovered values of full-size cars declined the most, tumbling by 1.15% or $136.
Again volume-weighted, Black Book said overall truck segment values (including pickups, SUVs, and vans) dropped by 0.54% last week. The previous four-week average in the truck space came in at 0.35%.
In the truck arena, values of compact vans and small pickups declined the most, sliding by 1.01% and 0.89%, respectively.
Meanwhile, multiple Black Book representatives stationed at nearly 60 sales nationwide mentioned the growing trend of no-sales. Here is the rundown:
— From Tennessee: “Small trucks and SUVs seemed to be in demand, but we had lots of no-sales. The market is getting soft.”
— From Michigan: “We had a higher supply of vehicles this week. Retail is not good here so that, coupled with the increase in consignment, resulted in lower values.”
— From Wisconsin: “Lots on no-sales with sporadic bidding or no bids at all, creating downward pressure on prices.”
— From Nevada: “The trucks improved this week, but dealers remain hesitant to add inventory to their retail lots.”
Just like the temperatures outside, Black Book is expecting used-vehicle values to cool for the remainder of the year.
On Tuesday, Black Book released its Used Vehicle Retention Index for September, which came in at 115.9. The reading marked a 0.6% decrease from August, when it was 116.6.
“The used market held up pretty well during summer when traditionally, the values have declined,” Black Book executive vice president of operations Anil Goyal said in a news release.
“However, we are now starting to see that the market strength is waning. We expect the index to continue to drop in the remaining months of the year,” Goyal continued.
The Black Book Used Vehicle Retention Index is calculated using its published wholesale average value on 2- to 6-year-old used vehicles as a percent of original typically-equipped MSRP. It is weighted based on registration volume and adjusted for seasonality, vehicle age, mileage and condition.
The index dates to January 2005 when Black Book published a benchmark index value of 100.0 for the market. During 2008, the index dropped by 14.1% while during 2016, the index fell by just 6.4%.
During 2011, the index rose strongly from 113.3 to 123.0 by the end of the year as the economy picked up steam and used vehicle values rose higher. It continued to remain relatively stable, rising slightly until May of 2014 when it hit a peak of 128.1.
To obtain a copy of the latest Black Book Wholesale Value Index, go to this website.
Want a good deal on a used vehicle? Get a beige one.
According to automotive research firm and car search engine iSeeCars.com, some vehicle paint colors can mean good deals for used-vehicle shoppers. iSeeCars defined deals as 10% or more off a car’s market value.
In analyzing more than 4.1 million vehicles to see which car colors resulted in deals, the iSeeCars study found that less-popular colors don’t always bring the best savings, said iSeeCars chief executive Phong Ly. Common and uncommon colors can bring deals to those looking for a used vehicle.
Buyers are 24.3% more likely to get a deal on a beige-colored vehicle than the average vehicle. Beige ranks ninth in terms of popularity among vehicle colors, well behind the most popular color choices for consumers.
Those popular colors are black, white, silver, and gray.
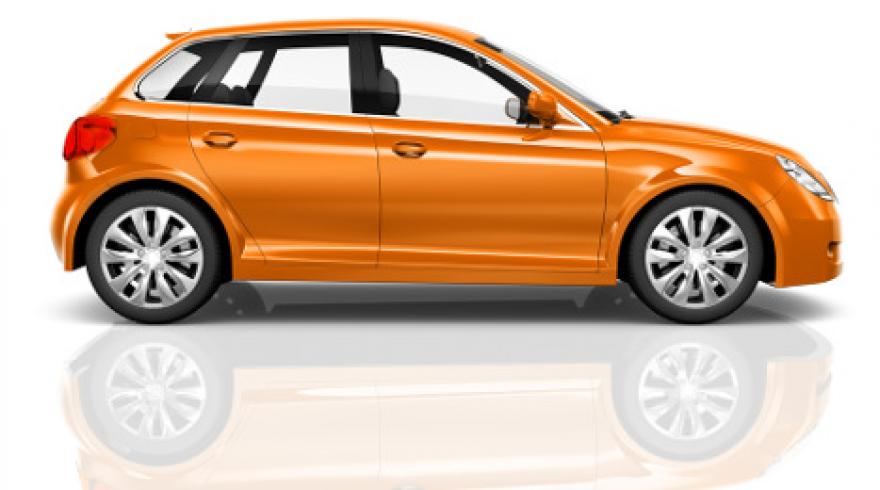
Buyers of orange vehicles are least likely to get a deal.
Within specific vehicle segments, beige sees the most discounts on minivans and SUVs and the second-most for passenger cars.
“Beige vehicles accrue the highest mileage of all car colors, suggesting that it’s a common color for daily drivers that tend to have less flashy colors,” Ly said.
Ly expanded on the beige theme, listing vehicles of that color with the most frequent discounts. Those are Volkswagen Passat, the Chevrolet Malibu, the Chevrolet Equinox, and the Toyota Sienna.
The color coming in second place as most likely to provide deals: Gold.
Gold is another example of a less-common color that can get a significant deal for consumers, Ly said. Examples of gold vehicles providing the best discounts are the BMW 5 Series and the Lincoln MKZ Hybrid.
Ly also addressed two popular car colors that were less likely to have deals than average: red at No. 13 and white at No. 11.
“The red and white models that are most abundant in the used car marketplace are pickup trucks, which is the vehicle segment that is least likely to be discounted,” Ly said.
Other colors less likely to provide deals than average are less popular colors such as yellow at No. 9, green at No. 10, teal at No. 12, purple at No. 14, and orange at No. 15.
The survey also broke out its list over vehicle segment. Beige is the color with the greatest chances of finding SUV deals. For pickups, white is most likely to be discounted. And brown is the most likely sports car color to see a discount.
iSeeCars ranking of car deals by color
1. Beige
2. Gold
3. Silver
4. Black
5. Brown
6. Gray
7. Blue
8. Pink
9. Yellow
10. Green
11. White
12. Teal
13. Red
14. Purple
15. Orange
The softening of wholesale prices has accelerated, according to the latest Black Book Market Insights report.
Analysts spotted decreases a week ago significantly higher than the average seen during the previous four weeks for both cars and trucks.
“Used-vehicle market strength is waning as depreciation rates increased week over week,” Black executive vice president of operations Anil Goyal said
“Auctions reported that it was harder to receive increased bids,” Goyal added in the latest report.
Volume-weighted, Black Book determined that overall car segment values dropped by 0.39% last week. That’s more than double the four-week average that analysts pegged at 0.16%
Among cars, analysts found that values of midsize cars declined the most, sliding by 0.63% or $56.
Again volume-weighted, Black Book reported that overall truck segment values (including pickups, SUVs, and vans) softened by 0.37% last week. During the previous four-week stretch, analysts pinpointed the average drop at 0.19%.
In the truck space, Black Book found that values of small pickups and compact vans declined the most, decreasing by 0.70% and 0.63%, respectively.
Moving along to what Black Book representatives at nearly 60 sales nationwide observed, the anecdotes supported the pricing metrics analysts computed.
An auctioneer in Illinois told Black Book’s lane watcher, “Similar to last week, prices are trending down.”
An auction general manager in North Carolina added, “Our auction is still selling around 60% of the vehicles offered, which is pretty good for September. We are experiencing more challenges week to week in order to keep those percentages at those numbers.”
Black Book’s representative in Ohio reported, “More no-sales, more sales with a call and harder to receive bids today.”
And finally out in Nevada, a sale unfolded similarly with the Black Book representative noting, “The market has softened. Some dealers seemed to be holding back for more money, but they did sell the higher mileage units.”
Kelley Blue Book’s 5-Year Cost to Own data was previously only available on KBB.com.
Now, the data — which considers depreciation, expected fuel costs, finance and insurance fees, maintenance and repair costs, and state fees for new vehicles — is available for syndication via API.
Kelley Blue Book says customers can now integrate the information “within their own website experiences,” which the company says helps consumers be more informed about the total ownership cost picture of the new vehicles they are thinking about purchasing.
The company develops its Kelley Blue Book 5-Year Cost to Own information using Kelley Blue Book Residual Values to calculate depreciation costs.
Kelley Blue Book applies what it describes as a “sophisticated valuation methodology” to calculate total ownership costs for new vehicles, and it also applies important financial data from third-party providers.
The company also uses the data each year to announce the winners of it 5-Year Cost to Own Award. The award honors the new vehicles and brands with the lowest projected ownership costs.
The data is available now to OEM, dealer, website publisher and auto industry product developers.
Kelley Blue Book senior director of syndication Damon Bennett said that with Kelley Blue Book’s 5-Year Cost to Own breaking down typical ownership costs, consumers can evaluate the out-of-pocket expenses they will incur beyond simply a new car’s initial purchase price.
“Given the extensive data insights available across Cox Automotive, we are excited our customers now can leverage another industry-leading product within our syndication portfolio that offers valuable information to help smooth the car-buying process for consumers and dealers alike,” Bennett said in a news release.
Autumn officially arrived on Monday, and perhaps dealers might start to see wholesale prices cooling in the lanes, too, if the latest Black Book Market Insights report is any indication.
Analysts spotted overall price decreases last week for both cars and trucks at greater rates than the previous four-week average. Along with fall’s arrival, Black Book executive vice president of operations Anil Goyal discussed another potential reason for the movement.
“Used-vehicle prices are starting to show weakness after a strong summer season,” Goyal said in the latest report.
“Auctions reported lower sales percentages as sellers held on to higher floors,” continued Goyal, who is among the experts on tap to appear during Used Car Week, which begins on Nov. 11 in Las Vegas.
Volume-weighted, Black Book reported that overall car segment values decreased by 0.25% last week. That’s a bit higher than the average (0.19%) analysts noticed during the previous four-week stretch.
Among cars, analysts determined values of prestige luxury, luxury, and midsize cars dropped the most, dipping by 0.58%, 0.35% and 0.43%, respectively.
Again, volume-weighted, Black Book found that overall truck segment values (including pickups, SUVs, and vans) declined by 0.39% last week. That’s nearly double the previous four-week average, which was 0.20%.
In truck space, analysts said values of all three categories of luxury SUVs slid the most as compacts were off by 0.77%, midsize by 0.69% and full-size by 0.61%.
Wrapping up the latest report, Black Book relayed some of the best anecdotes it received from representatives stationed at nearly 60 sales nationwide. Here is the rundown:
— From Tennessee: “We had a lot of no-sales today even though the dealers continue to say that the market remains good.”
— From Indiana: “The truck prices seem to be holding steady in spite of the incentives on the new ones.”
— From Wisconsin: “The market here is OK for September, but there is downward pressure on the values as well as lower sales percentages.”
— From Georgia: “Overall, the quantity and quality of the vehicles declined. Sold prices were definitely down compared to the last few weeks.”
More trucks and SUVs moved down the lanes in August, and KAR Auction Services chief economist Tom Kontos detailed how that change in volume mix impacted wholesale prices.
According to ADESA Analytical Services’ monthly analysis of wholesale used-vehicle prices by vehicle model class, wholesale used-vehicle prices in August averaged $11,244, which was 1.8% lower compared to July but 1.8% higher relative to August.
Kontos noted all segments showed month-over-month declines in average prices except full-size vans and full-size SUV/crossovers.
“Average wholesale prices in August fell relative to July but remained up on a year-over-year basis,” Kontos said in his latest edition of the Kontos Kommentary released this week.
“The year-over-year price growth was due to the strength and growing share of truck-segment sales, as car prices fell on a monthly and annual basis overall, though they remained up for off-lease units,” he added.
Kontos elaborated about prices moving higher on a year-over-year basis for both midsize cars and midsize SUV/CUVs that likely are coming off of a lease. Kontos dissected the price data by holding constant for sale type, model-year age, mileage, and model class segment — using criteria that characterize off-lease units.
As a result, prices for those particular midsize cars climbed 1.7% or $211 to $12,671, while prices for those specific midsize SUV/CUVs rose 1.5% or $320 to $21,252.
Elsewhere in the wholesale arena in August, Kontos noted average wholesale prices for used vehicles remarketed by manufacturers jumped 2.4% month-over-month and 5.3% year-over-year.
Kontos mentioned prices for fleet/lease consignors softened 1.5% sequentially but edged up 1.2% annually.
Finally, Kontos added that average prices for dealer consignors in August declined 2.0% versus July but inched up 0.2% relative to August of last year.
ADESA Wholesale Used-Vehicle Price Trends
| |
Average |
Price |
($/Unit) |
Latest |
Month Versus |
| |
August 2019 |
July 2019 |
August 2018 |
Prior Month |
Prior Year |
| |
|
|
|
|
|
| Total All Vehicles |
$11,244 |
$11,452 |
$11,048 |
-1.8% |
1.8% |
| |
|
|
|
|
|
| Total Cars |
$8,465 |
$8,654 |
$8,692 |
-2.2% |
-2.6% |
| Compact Car |
$6,530 |
$6,609 |
$6,481 |
-1.2% |
0.8% |
| Midsize Car |
$7,312 |
$7,444 |
$7,590 |
-1.8% |
-3.7% |
| Full-size Car |
$7,592 |
$7,886 |
$7,510 |
-3.7% |
1.1% |
| Luxury Car |
$13,080 |
$13,347 |
$13,615 |
-2.0% |
-3.9% |
| Sporty Car |
$14,219 |
$14,673 |
$14,367 |
-3.1% |
-1.0% |
| |
|
|
|
|
|
| Total Trucks |
$13,382 |
$13,618 |
$13,040 |
-1.7% |
2.6% |
| Minivan |
$8,118 |
$8,404 |
$8,222 |
-3.4% |
-1.3% |
| Full-size Van |
$13,748 |
$13,082 |
$13,784 |
5.1% |
-0.3% |
| Compact SUV/CUV |
$10,923 |
$11,173 |
$10,765 |
-2.2% |
1.5% |
| Midsize SUV/CUV |
$11,548 |
$11,774 |
$11,060 |
-1.9% |
4.4% |
| Full-size SUV/CUV |
$14,248 |
$14,084 |
$13,370 |
1.2% |
6.6% |
| Luxury SUV/CUV |
$18,465 |
$18,839 |
$18,491 |
-2.0% |
-0.1% |
| Compact Pickup |
$11,080 |
$11,345 |
$10,228 |
-2.3% |
8.3% |
| Full-size Pickup |
$17,061 |
$17,479 |
$16,638 |
-2.4% |
2.5% |
Source: ADESA Analytical Services.