As dealers looked to accelerate sales to close July, Black Book noticed vehicle depreciation moved in a similar way to finish the month.
The latest Black Book Market Insights report indicated most vehicle segments increased in depreciation during late July. Out of all car and truck segments, editors determined full-size pickups retained their value the best, only decreasing in value by 0.06 percent.
“Car values dropped sharply in the last week of July. It was the highest depreciation in car segments in 20 weeks,” said Anil Goyal, senior vice president of automotive valuation and analytics at Black Book.
Editors offered more details after looking at the volume-weighted data where they found that overall car segment values decreased by 0.54 percent last week. That figure is higher than the average weekly decrease of 0.30 percent in values spotted during the previous four weeks.
Black Book reported the midsize car, sporty car, full-size car and prestige luxury car segments declined the most — each one by about 0.65 percent.
Reviewing volume-weighted information, editors discovered overall truck segment values (including pickups, SUVs and vans) softened by 0.32 percent last week, higher than the average weekly decrease of 0.15 percent in values registered during the previous four weeks.
Editors added small pickup and compact crossover/SUV values declined the most among truck segments by 0.64 percent and 0.54 percent, respectively.
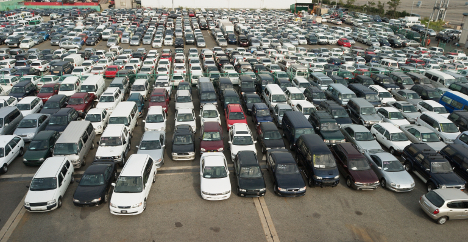
Turning next to cover what lane observers relayed back to Black Book headquarters, one of the highlights likely stemmed from DAA Northwest’s Rock & Roll Sale.
While not mentioning the annual event by name, the Black Book representative from Washington reported, “I attended a huge event sale that had over 5,000 vehicles consigned over two consecutive days with a concert sandwiched in between. They sold around 70 percent of the vehicles and an average sale price of $18,000, both of which were amazing numbers.”
Elsewhere around the country, some auction reports weren’t quite as rosy, beginning in Tennessee.
“Not much speculating happening here as a lot of dealers are buying only the vehicles that they have retail orders for,” Black Book’s representative in the Volunteer State said.
Up in Michigan, it still might be summertime, but, “Dealers are already preparing for fall as the four wheel drive trucks are receiving most of the attention.”
Down in Florida, the hammer didn’t fall as much as it sometimes does. Black Book’s personnel noticed, “It was a tough auction here because the corporate reps were holding tight on their floor prices. The result was a lot of no-sales.”
And finally from Pennsylvania, the action was a bit busier, at least in one part of the facility.
“I watched a dealer lane sell almost everything that came through with most fetching good values. In-lane attendance was sparse, but there were consistently around 115 online buyers for the entire run in that particular lane,” Black Book’s observer said.
Black Book editors could have broken out a thesaurus on Tuesday when releasing their Used Vehicle Retention Index for July. Upon looking for the right adjective to summarize the latest reading, they could have picked among steady, stable, firm, fixed, unchanged or unwavering.
The reason why is the July index reading came in the same as it was in June, resting at 113.0. Black Book’s index has now moved slightly positive or remained unchanged during three of the last four months.
The Black Book Used Vehicle Retention Index is calculated using Black Book’s published wholesale average value on 2- to 6-year-old used vehicles, as percent of original typically-equipped MSRP.
Editors noticed full-size cars, full-size pickups, luxury cars, and near-luxury cars all saw noticeable gains in their respective segment Indexes during July. Black Book added that pickups remain popular because of the price of gas and overall supply in the market, while each of these car segments offer decent value currently, resulting from several months of sharp valuation declines over the last few years.
“What we’re experiencing over the last few months are signs of a resilient used-vehicle market, where the bottom is not dropping out as some had expected this year,” said Anil Goyal, senior vice president of automotive valuation and analytics for Black Book.
“We’re paying close attention to several car segments, in particular, compact car and midsize car, which continue to weaken as demand remains soft and used supplies build,” Goyal continued. “In addition, the overall economy and credit availability conditions will influence the retention strength moving forward.”
The index dates back to January 2005 when Black Book published a benchmark index value of 100.0 for the market. During 2008, the index dropped by 14.1 percent while during 2016, the index fell by just 6.4 percent.
During 2011, the index rose strongly from 113.3 to 123.0 by the end of the year as the economy picked up steam and used-vehicle values rose higher. It continued to remain relatively stable, rising slightly until May of 2014 when it hit a peak of 128.1.
To obtain a copy of the latest Black Book Wholesale Value Index, go to this website.
As the temperatures spike outside, Black Book isn’t quite seeing wholesale prices behave in the opposite extreme, which is sometimes the norm as we enter the remaining days of July.
The newest Black Book Market Insights report showed more SUVs dropping in price last week. In fact, editors noticed sub-compact luxury crossovers saw the most depreciation out of all segments, decreasing in value by 1.53 percent.
Meanwhile, the volume-weighted information determined that overall car segment values decreased by 0.34 percent last week, higher than the average weekly decrease of 0.27 percent in values over the previous four weeks.
Editors noted that sub-compact car, mid-size car and luxury car segments declined the most by 0.53 percent, 0.53 percent and 0.48 percent, respectively.
Again volume-weighted, Black Book found that overall truck segment values — including pickups, SUVs and vans softened by 0.30 percent last week, higher than the average weekly decrease of 0.14 percent in values during the previous four weeks.
Editors added full-size pickup was the best performing truck segment while the sub-compact luxury crossover segment declined the most.
“Used vehicle values are holding well considering it is middle of July when we normally start to see a steeper seasonal drop,” said Anil Goyal, Black Book’s senior vice president of automotive valuation and analytics.
Turning next to what Black Book’s representatives in the lanes noticed last week, observers didn’t spot any situations too out of the ordinary with August approaching.
According to a report out of the Northwest, action in Washington produced, “A normal July sale this week. Pickup trucks commanded the most attention and the strongest values.”
In Colorado, a similar situation unfolded. “Everything sold pretty well today but the inventory is down here from a normal July. Overall, it was a typical sale with regard to the number sold.”
Up in Wisconsin, Black Book’s lane watcher said, “It seemed as if there were more average and rough vehicles in the sale today. Despite the condition of the vehicles they sold well overall.”
And the other two reports percolated out of Texas where one observer mentioned, “Values were down on the rental vehicles today especially when the vans hit the sale blocks.”
The other anecdote from the Lone Star State mentioned, “Attendance was down considerably in the lanes, but the Internet buyers were stepping up. They were paying the floor prices or more which made for a good sale.”
Editors turned a phrase for this week’s Black Book Market Insights report, highlighting that “a mixed bag of vehicle valuation strength” summarized the activity in the lanes.
Black Book noticed that some cars and trucks produced a “widening” gap in strength with compact vans and luxury cars generating price gains. But editors also found that several other segments saw “larger-than-normal” depreciation on the week.
“Sales reports from various auto auctions were generally positive as buyers showed interest in clean vehicles from commercial consignors,” said Anil Goyal, Black Book’s senior vice president of automotive valuation and analytics.
According to volume-weighted data, Black Book reported overall car segment values decreased by 0.36 percent last week, higher than the average weekly decrease of 0.27 percent in values seen over the previous four weeks.
Editors indicated the compact car, midsize car and full-size car segments declined the most by 0.87 percent, 0.45 percent and 0.37 percent, respectively.
Looking again at that volume-weighted data, Black Book determined overall truck segment values — including pickups, SUVs and vans — softened by 0.23 percent last week, a bit above the average weekly decrease of 0.14 percent in values over the previous four weeks.
Compact van was the best performing truck segment while the full-size luxury crossover/SUV segment declined the most.
Moving over to the anecdotes Black Book’s representatives collected from the lanes, the theme of “mixed bag” continued as activity picked up a bit coming out of Fourth of July.
One busy place was not far from Black Book’s headquarters in Georgia, where the observer shared, “Volume was higher than normal. Dealers were positive about the market even though there were more ‘if’ sales than normal.”
Nearby in North Carolina, a similar scene unfolded as the story went like this: “A good crowd today that came prepared to buy. They sold more than they have been with an average amount of no-sales.”
Meanwhile, the three other lane watchers who reported back to Black Book described softer action.
From Pennsylvania: “Based on the fewer dealers in the lanes, this should have been a poor sale but the online bidders saved the day with their purchases.”
From Michigan: “The market needle didn’t move either way today. It was a smaller consignment so the sale was short with an average sales percentage.”
And finally out West in California: “A below normal sale today even though there were cleaner vehicles in inventory, bringing really strong money.”
J.D. Power Valuation Services might have sounded like the firm formerly known as NADA Used Car Guide was repeating itself when analysts shared both their assessment of used-vehicle price movement in June and their projection for July.
According to the latest edition of Guidelines, J.D. Power Valuation Services reported that wholesale prices of used vehicles up to 8 years old softened by 2.2 percent in June, a dip in line with analysts’ expectations.
And it turns out when looking to what might happen in July, J.D. Power Valuation Service is predicting that wholesale prices for these vehicles will again drop by 2.2 percent, a reading not quite as dramatic as what analysts recorded during that month a year ago.
“At the segment level, mainstream losses are expected to be relatively consistent across the board,” analysts said in the report. “Midsize and large pickups continue to perform very well and are forecast to outperform the industry average.
“Losses for all premium segments are forecast to fall by slightly more than the industry average for the month,” analysts continued.
Looking toward full-year expectations, J.D. Power Valuation Services predicted that used-vehicle prices should decline by about 6 percent, which would be 2 percentage points higher than the final decrease of 4 percent seen for all of 2016.
“Ongoing increase in supply, higher incentives and a normalizing retailing environment — including credit conditions — will ultimately dictate losses,” analysts explained in the report.
J.D. Power Valuation Services arrived at its full-year projection after reviewing June’s movements, which analysts pointed out typically land at about 2.2 percent dating back over the past five years.
The June reading also left the J.D. Power Valuation Services’ Seasonally Adjusted Used Vehicle Price Index unchanged at 111.1. While staying flat on a sequential basis, the June index reading is 7.6 percent lower than what analysts recorded last June (120.2).
Looking closer at the June information, J.D. Power Valuation Services noted that prices decreases for subcompact, compact, midsize and large cars all settled between 3.2 percent and 3.4 percent.
Also of note, the 3.4 percent drop for large cars led the entire car segment and it also was the largest decrease for those kinds of vehicles since June 2001 when analysts noticed a 3.7 percent tumble.
“Most of the large car segment’s makes and models had a fairly average performance in June,” analysts said in the report, while adding that sharp price drops for the Chrysler 300 and Dodge Charger from the 2010 to 2013 model years triggered much of the overall movement, and in particular the 7 percent fall-off for the 2010 Dodge Charger.
Meanwhile, J.D. Power acknowledged the June decreases for subcompacts and compacts were not “outside historical norms” as declines of about 3 percent for these segments have been seen during the past five years.
As far as price declines for the utility segments, analysts classified them as “scattered” in the June report. Midsize utilities averaged a 1.5 percent price softening in June as prices for compact utilities dipping slightly more at 2.2 percent.
Analysts added prices for midsize vans declined less than 1 percent in June.
As far as trucks go, J.D. Power explained these units are “continuing their run of wholes price dominance.” The report indicated prices for large and midsize pickups ticked up by 0.1 percent and 0.2 percent, respectively, in June.
“Over the past five years, pickup prices have performed well compared to the rest of the industry on average,” analysts said in the report. “That stated, prices typically declined slightly during the period.
“While sales were strong across the board in the midsize pickup group, 2015 Chevrolet prices were exceptionally strong and increased by an average of just below 3 percent,” analysts added.
J.D. Power Valuation Services closed its latest price discussion by touching on the luxury side of the market, noting that all premium segments outperformed the overall industry average in June.
Analysts pointed out that luxury midsize utilities did experience their largest price drop so far in 2017 by dropping by an average of 2.1 percent in June. However, the report mentioned that figure was nearly identical to what’s been recorded in June for these units going back five years.
Other segments of note in the luxury categories included June prices for luxury large cars dipping by 1.2 percent and June prices for luxury midsize cars softening by 1.8 percent.
KAR Auction Services chief economist Tom Kontos continues to be intrigued by the special slice of wholesale data he began to share three months ago that’s produced a consistent trend counter to the overall price reading.
But first, let’s look at that overall movement.
According to ADESA Analytical Services’ monthly analysis of wholesale used vehicle prices by vehicle model class, wholesale used vehicle prices in June averaged $11,067 — down 0.7 percent compared to May but up 4.7 percent relative to June of last year.
Kontos explained in this video that’s also available at the top of this page that compact and full-size pickup trucks and minivans showed significant average price gains for the month, while most other model classes registered month-over-month declines or modest increases. He reiterated that the year-over-year growth in minivan prices is exaggerated by newer models as discussed in January’s report.
And now to the other data trend garnering Kontos’ attention. Kontos indicated average prices for both of the two “bellwether” car and truck segments were down by about 4 percent year-over-year, reflecting growth in off-lease supply.
Prices for midsize cars that are 3-years-old with mileage reading between 36,000 and 45,000 miles dropped by $515, or 4.3 percent, to $11,474. And prices for midsize CUVs and SUVs at the same age and mileage declined by $809, or 3.9 percent, to $19,723.
“Average wholesale prices in June were down versus May but up on a year-over-year basis,” Kontos said. “However, drilling down into the data once again clearly reveals price softening on a year-over-year basis when accounting for sale type, vehicle age, model class and mileage.”
Kontos went on to mention that average wholesale prices for used vehicles remarketed by manufacturers in June were down 1.0 percent month-over-month and down 1.9 percent year-over-year.
He added that prices for fleet/lease consignors dipped 1.1 percent sequentially and up 3.2 percent annually.
Kontos went on to mention that average prices for dealer consignors ticked up 0.9 percent versus May and up 7.7 percent relative to June of last year.
ADESA Wholesale Used-Vehicle Price Trends
| |
Average |
Price |
($/Unit) |
Latest |
Month Versus |
| |
June 2017 |
May 2017 |
June 2016 |
Prior Month |
Prior Year |
| |
|
|
|
|
|
| Total All Vehicles |
$11,067 |
$11,140 |
$10,571 |
–0.7% |
4.7% |
| |
|
|
|
|
|
| Total Cars |
$8,808 |
$8,955 |
$8,562 |
–1.6% |
2.9% |
| Compact Car |
$6,744 |
$6,836 |
$6,465 |
-1.3% |
4.3% |
| Midsize Car |
$7,781 |
$7,967 |
$7,658 |
-2.3% |
1.6% |
| Full-size Car |
$7,747 |
$8,395 |
$7,367 |
-7.7% |
5.2% |
| Luxury Car |
$13,817 |
$13,767 |
$13,078 |
0.4% |
5.6% |
| Sporty Car |
$14,420 |
$14,310 |
$14,274 |
0.8% |
1.0% |
| |
|
|
|
|
|
| Total Trucks |
$13,194 |
$13,247 |
$12,595 |
–0.4% |
4.8% |
| Minivan |
$9,243 |
$9,117 |
$7,830 |
1.4% |
18.0% |
| Full-size Van |
$12,859 |
$13,360 |
$12,500 |
-3.8% |
2.9% |
| Compact SUV/CUV |
$10,567 |
$10,877 |
$10,882 |
-2.8% |
-2.9% |
| Midsize SUV/CUV |
$11,702 |
$11,860 |
$11,118 |
-1.3% |
5.3% |
| Full-size SUV/CUV |
$13,995 |
$14,077 |
$13,657 |
-0.6% |
2.5% |
| Luxury SUV/CUV |
$19,186 |
$19,321 |
$18,842 |
-0.7% |
1.8% |
| Compact Pickup |
$9,651 |
$9,368 |
$8,718 |
3.0% |
10.7% |
| Full-size Pickup |
$16,953 |
$16,778 |
$15,836 |
1.0% |
7.1% |
Source: ADESA Analytical Services. May data revised.
As the calendar reached the midpoint of 2017, Black Book spotted some wholesale price movements that experts say might differ during the remainder of the year.
According to Black Book data, the average price of a used vehicle in June for model years 2012 through 2016 decreased in value by 1.3 percent, slightly more than the 1.2 percent change in May.
Editors indicated overall car values dropped by 1.8 percent in June; the same rate seen in May. Meanwhile, Black Book found that trucks decreased 0.8 percent in value during June.
Black Book went on to note that all vehicles are averaging a 12-month depreciation of 16.7 percent.
In June, small pickups had the lowest monthly depreciation at 0.1 percent. Vehicles in the small pickup segment include the Toyota Tacoma, Chevrolet Colorado, GMC Canyon, Nissan Frontier and the Honda Ridgeline. Vehicles in this segment finished June with an average price of $21,328, a 7.3 percent drop from a year ago.
On the opposite end of the spectrum, sub-compact cars saw the largest depreciation during the month at 2.8 percent. Vehicles in the sub-compact car segment include the Chevrolet Sonic, Ford Fiesta, Honda Fit, Toyota Yaris, Nissan Versa, Kia Soul and the Hyundai Accent. Vehicles in this segment finished June with an average price of $6,554, a 22.0 percent decline from a year ago.
Black Book determined the segment with the largest 12-month depreciation currently is prestige luxury cars (down by 25.4 percent). Vehicles in the prestige luxury car segment include the BMW 7-Series, Lexus LS 460, Porsche Panamera, Jaguar XJ, Mercedes Benz S-Class and the Audi A8. This segment finished June with an average price of $34,894, down from $46,781 a year ago.
Over the past three months, editors noticed two segments have shown unchanged value or an increase in overall value: full-size pickups are unchanged, and small pickups have gained 0.2 percent in value.
Sub-compact luxury CUVs represented the truck segment with the largest monthly depreciation in June, dipping by 1.8 percent. Vehicles in sub-compact luxury crossover segment include the Audi Q3, BMW X1, Mercedes Benz GLA Class and the Mini Cooper Countryman. Vehicles in this segment finished the month with an average value of $16,388, an 18.9 percent change from a year ago.
“Falling gas prices in the month of June resulted in pockets of strength in used vehicle valuations,” said Anil Goyal, Black Book’s senior vice president of automotive valuation and analytics.
“Pickup trucks and large utilities have been strong so far this year while small cars have continued to drop, but the remainder of 2017 is expected to show differing trends in terms of vehicle retention strength,” continued Goyal, who will be one of the many experts on hand for Used Car Week 2017, which begins on Nov. 13 in Palm Springs, Calif.
Your credit is good and the lease contract on your 2015 vehicle is about to expire: what are your options? You could choose to pay the residual and keep your current ride. You could trade the vehicle for a new one or for an alternative used car. Finally, you could hand in the keys and wait for the bus to take you back home.
When thinking about the effect of the ongoing surge in off-lease volume, it is important to keep these options firmly at the front of mind. Market participants are right to fret about the possible effects of off-lease volume, but not for the reasons usually put forward. Returning an off-lease vehicle certainly causes an increase in supply but, usually, it also generates demand for a replacement vehicle.
Determining the manner in which these forces balance is not a straightforward exercise. One could argue that if the customer leaves with a higher valued vehicle, there has been a net increase in demand because of the transaction. Yesterday the customer was happy driving a $10,000 car. Today they are driving a $20,000 car, therefore they have demanded “more” car. If the client leaves on foot, or in a lower valued vehicle, the net result is an increasing supply to the market. Most commentators, when considering the ongoing surge in off-lease volume, ignore this complexity, recognizing the car entering the lot but ignoring the one that leaves.
The other point is that the distinction between the new and used markets for cars, at least on the demand side, is a fine one indeed. The last time I bought a car, I entered the dealership determined to buy a used Jeep Wrangler. That I drove away in a brand new one suggests either that relative prices were favorable or the sales person was very good at their job. If a sucker, like myself, is enticed to switch to a new car, the used car market does not really suffer. There exists only a market for cars, and players in this space would, frankly, rather sell you an expensive new one than a cheaper old one. If someone swaps their used off-lease vehicle for a new one, this transaction is a positive outcome for all players in the auto industry.
In reality, only three factors unambiguously affect the overall supply of cars in the economy and hence the prices we expect for cars for a given level of demand. The factors are domestic new production, net imports of new and used vehicles, and the rate at which older vehicles are retired from service.
The first two of these factors are easy to quantify using readily available statistics. Compiling data from various trade sources, we find that real net vehicle imports grew by 20.4 percent in 2015 before slowing to 5.8 percent in 2016. Domestic production, meanwhile, continued its slow secular decline that began immediately after the recovery from the Great Recession. The number of cars manufactured in the U.S. fell by 2.1 percent in 2015 and by 5.9 percent last year. These figures should be viewed in the context of consecutive record new vehicle sales numbers over the past two years. If we assume that imports and home-grown cars are roughly equally prevalent, we find that there was a surge in vehicle supply in 2015. This surge was driven primarily by a climbing greenback, but 2016 was basically a wash.
New vehicle manufacturers from around the world might be tempted by the surge in off-lease volume to increase production relative to baseline. People returning three year old leased cars, after all, have recently demonstrated a willingness and an ability to drive a new car away from a dealership. Carmakers know that these people are prime prospects because they need wheels the moment the keys are returned. If this sales strategy is unsuccessful, which happens if non-traditional lessees return to used car ownership, we might be left with a glut of cars in the marketplace that are too new for the prevailing market.
At the other end of the spectrum, a consideration of old car retirement is also needed. We recently conducted a deep-dive on the nature of U.S. passenger vehicles by considering the most recent Consumer Expenditure Survey, conducted in 2015. Respondents were asked about the vehicles they owned and model years were recorded. We can use these data to determine, with some precision, the age profile of the U.S. vehicle fleet.
In 2008, on the eve of the Great Recession, 42 percent of vehicles owned by Americans were ten or more years old. By 2015, in contrast, a full 52 percent of vehicles had been around for a decade or more. The aging fleet is partly due to ongoing improvements in production standards. The numbers also suggest, though, that there are lots of clapped out cars on the road that are due to be retired. By our calculations, the number of vehicles entering retirement each year grows by 25 percent between 2013 and the high-water mark that arrives in 2019. This high rate of vehicle retirement represents a reduction in supply that helps to cushion any increase in production at the new end of the pipeline.
The other startling feature is the dearth of autos in the 5- to 9-year-old range — vehicles that were introduced to the market during the depths of the recession. In 2008, 34.6 percent of cars fell in this band but had fallen to only 24.6 percent by 2015. If lessors are currently feeling the heat, it is nothing compared to the inferno they will face if they are currently originating large volumes of three-year leases. The rate of vehicle retirements plummets in 2020 as the thin cohorts hit peak retirement age. This inevitable process yanks away the cushion from the vehicle supply chain.
To summarize, we currently have lots of new cars, lots of old cars, and very few middle aged cars in the national fleet. This situation leads to some interesting dynamics in the pricing of automobiles. For one thing, the prevalence of lightly used cars means that new vehicle manufacturers have very little pricing power. We have seen new vehicle sales fall markedly this year, and generous incentives have been offered to move stock.
We have also seen significant compression in used car prices. This can be seen, for example, in the average of all wholesale transactions for 0-3 year old vehicles from the NADA Auction.net database. Our analysis shows that prices of light trucks have fallen by 3 percent since their peak value in 2011, while car prices have declined by a full 13 percent. In contrast, 4- to 6-year old cars have fallen by only 4 percent while older trucks have surged higher by 10 percent. In other words, relative discounts one might expect when purchasing an older vehicle have declined considerably. People who are in the market for a 5-year old car are finding that they can get a 3-year old version without spending much more money.
So, where does all this analysis leave us? It is the combination of too much production and insufficient demand for new vehicles that is depressing newer car prices. It is not that there are too many cars in the market alone. Production (which includes imports) has shown signs of slowing, suggesting that manufacturers have worked to curtail the emergent glut of new cars.
Financial interests are far more exposed to prices of new and slightly used cars than they are to prices of older cars and clunkers. Markets are therefore watching the auto industry closely for signs of strain.
When thinking about car prices, close attention should be paid to the nature of vehicles being driven; the manner of their financing is rather less consequential.
Tony Hughes is a managing director at Moody’s Analytics, where he leads the development of used-car price forecasts. Hughes also conducted a webinar about this topic with Auto Remarketing earlier this year that’s available here.
With Fourth of July influencing the measurements, the newest Black Book Market Insights report indicated both car and truck values remained relatively stable week-over-week.
Out of both segments, editors noticed six vehicle categories maintained their values as depreciation was unchanged, with one additional vehicle category, full-size vans, increasing its value by 0.01 percent.
“Wholesale prices remained stable last week as dealers reported good sales during the Fourth of July weekend,” Anil Goyal, senior vice president of automotive valuation and analytics, said in an analysis .
“Bidding was active in the auction lanes for clean vehicles,” added Goyal, who will be one of the many industry experts on hand for Used Car Week, which begins on Nov. 13 in Palm Springs, Calif. Early bird registration for Used Car Week is already available.
Looking at volume-weighted data, editors determined overall car segment values decreased by just 0.17 percent last week, better than the average weekly decrease of 0.31 percent in values they spotted during the previous four weeks.
Midsize car, full-size car and prestige luxury car segments declined the most by 0.28 percent, 0.28 percent and 0.25 percent, respectively.
Again analyzing volume-weighted information, Black Book indicated overall truck segment values — including pickups, SUVs and vans — decreased by only 0.05 percent last week, better than the average weekly decrease of 0.16 percent in values registered during the previous four weeks.
Full-size luxury crossover/SUV and subcompact luxury crossover values decreased the most among truck segments by 0.14 percent and 0.11 percent, respectively.
As Goyal referenced, Black Book’s representatives in the lane spotted aggressive bidding activity in many places, including:
From Pennsylvania: “The market here is still relatively good with auctioneers rarely having to fish for bids. Dealers are anxious to buy vehicles.”
From Colorado: “Good sale that was similar to last week as the dealers need inventory for the summer market push.”
From Georgia: “Attendance was average and the supply of inventory seemed slightly higher. There was not a lot of haggling between the final bidder and seller as most vehicles were being sold.”
The other two anecdotes from the lanes that Black Book shared stemmed from dealers being mindful of their floor-plan funds before the hammer dropped.
“I had dealers telling me that decent vehicles are very limited. Prices here are surprisingly high,” said Black Book’s representative in Illinois.
And Black Book’s observer stationed in Florida added, “Active sale here today but buyers were really concerned about overpaying. Sellers seemed to sense the normal post-holiday lull and were willing to negotiate in order to sell vehicles.”
While Manheim noticed record-setting metrics again for its latest monthly report, Black Book on Tuesday released its Used Vehicle Retention Index for June and observed a more modest sequential uptick and even a decline compared to a year ago.
Black Book found that its index edged higher to 113.0 in June, up from 112.3 in May. On a 12-month basis, the index dropped 4.5 percent compared last June.
Editors recapped that the Black Book Used Vehicle Retention Index is calculated using Black Book’s published wholesale average value on 2- to 6-year-old used vehicles, as percent of original typically equipped MSRP.
Perhaps not record-setting, Black Book acknowledged the Index rose for the second time in the past three months. It increased slightly in April due to a stronger-than-expected spring selling season for used vehicles, and it saw gains in June largely because falling gas prices helped with the sale of used trucks, crossovers and SUVs.
Despite these gains, editors pointed out that falling gas prices also meant a continuation of accelerated depreciation for subcompact and compact cars.
“In addition to falling gas prices, which are playing a role in driving a little more interest for certain trucks today, there are generally some very good deals out there for used vehicles currently,” said Anil Goyal, senior vice president of automotive valuation and analytics for Black Book.
“These are the primary reasons why we are seeing some bounce off the lows in used car retention trends,” Goyal continued.
The Index dates back to January 2005, where Black Book published a benchmark index value of 100.0 for the market. During 2008, the index dropped by 14.1 percent while during 2016, the index fell by just 6.4 percent.
During 2011, the index rose strongly from 113.3 to 123.0 by the end of the year as the economy picked up steam and used vehicle values rose higher. It continued to remain relatively stable, rising slightly until May of 2014 when it hit a peak of 128.1.
To obtain a copy of the latest Black Book Wholesale Value Index, go to this website.