In its latest Quarterly Market Report, ALG showed a year-over-year comparison of March/April 36-month residual value forecasts.
Of the 25 segments included in the report, only five had positive residual value changes from a year ago.
And they were all mainstream utility segments (which, according to ALG, includes minivans).
Asked why utilities have held onto their values so well, ALG chief industry analyst Eric Lyman said it is mostly due to increasing consumer demand over the past few years on that side of the market and the fact that gas prices are expected to be flat for the next three years.
And these fuel costs haven’t even increased as much as expected to this point, anyway.
While down 1.4 percentage points from a year ago, midsize pickups lead all segments with 36-month residuals of 64.8 percent.
And the top six segments for 36-month retention are either pickups or utilities, and all six have residuals above 51 percent.
Smaller car struggles
The premium subcompact had the most significant drop in residual value — going from 55.2 percent to 46.9 percent — and smaller car segments, in general, trended toward the bottom half of the residual value rankings.
This goes back to demand shift towards trucks, and even more so, the “fundamentals of the economy,” Lyman said. With strong economic fundamentals and relatively low gas prices, demand for smaller cars goes down, particularly the pure point-A-to-point-B type of vehicles.
“These are also low-margin segments for the automaker. So when consumer demand shifts away from these types of segments that aren’t as profitable for the automakers, the automakers are more than willing to refocus their attention both from a production and product development side towards the vehicles that are more profitable,” Lyman said in a phone interview.
“I think you can look at sort of the proliferation of the luxury pickup trucks — the really high-line (models) whether it’s a Ford Raptor or a Ford Limited Platinum type of vehicle — they’re going to pivot towards the vehicles that are in high demand and have bigger margins than vehicles that are really a challenge to squeeze out a profit in like the subcompact segment,” he said.
Overall, the 36-month benchmark residual forecast was 49 percent industry-wide, down from 49.8 percent a year ago.
ALG said this decline is “consistent with ALG’s expectations of gradual declines in used market values.”
Specialist brands lead auction retention
Also in ALG’s quarterly report was an analysis of 3-year-old auction retention changes by brand, with “specialist brands” leading the pack.
In the first quarter, Land Rover had the highest auction value retention at 64.5 percent, followed by Subaru at 59.7 percent, Jeep at 56.6 percent and GMC at 54.7 percent.
Overall auction retention for 3-year-old vehicles was 48.5 percent, down from 50.5 percent in the first quarter of 2016.
“Growth in used supply and expiration of pent-up demand from the Great Recession are leading causes of the downturn,” ALG said in the report.
OK, OK, OK. Want a sure sign the spring market is blooming in the auction lanes?
Perhaps, here it is.
The latest Black Book Market Insights report indicated compact cars performed the best out of all vehicle segments. On the other hand, editors noticed full-size vans saw the largest depreciation, dropping 0.38 percent in value last week.
However, Anil Goyal noted that most of both car and truck segments continued to show strong retention as the industry gets deeper into spring.
“Wholesale markets held steady last week with strong bidding in the auction lanes resulting in most car segments improving in values,” said Goyal, who is senior vice president of automotive valuation and analytics at Black Book.
Looking at volume-weighted data, editors determined overall car segment values increased by 0.16 percent last week. In comparison, the market showed similar performance increasing on average by 0.14 percent during the previous four weeks.
As mentioned, Black Book reported that most car segments increased in value. Compact car, sporty car and full-size car segments gained the most by 0.50 percent, 0.38 percent and 0.33 percent, respectively.
Again volume-weighted, editors found that overall truck segment values — including pickups, SUVs and vans — remained steady last week. In comparison, truck values depreciated by just 0.03 percent in the previous four weeks.
Minivans made up the best performing segment two weeks in a row whereas full-size vans declined the most by 0.38 percent.
Black Book personnel mingling in the lanes with dealers at about 60 auctions added more color to the spring market scene; alluding to the fact we might be at the peak in some locations.
That sentiment came from Texas where Black Book’s lane watcher said, “Great weather, lots of buyers and trucks are very strong. It’s possible that we are close to the top of the market.”
Another strong indicator came from southern California where the representative noted, “The market is really holding its head up with prices keeping pace.”
Elsewhere, the spring scene might still be in the budding stage such as in Georgia where Black Book gathered this report: “The sale started out really strong selling almost everything with high prices. Quickly though, no-sales and softer prices were the norm for the remainder of the auction.”
And in North Carolina, the story went, “Dealers remain optimistic as the spring market continues here. Luxury vehicles, whether they be SUVs or passenger cars are the only tough sales at the auction.”
Perhaps dealers still wondering when spring will come might operate out of the Midwest. That’s where two other reports from Black Book only gave a hint about spring.
Out of Michigan, Black Book received, “Retail is not as hot here as it should be but trucks were firm today with active bidding. Sport cars and convertibles are finally bringing spring values.”
And in Illinois, the lane watcher shared an assessment that might be valid at any time of year, relaying “Dealers say that they may pay more than a fair price to acquire the good, clean inventory that they need for retail.”
KAR Auction Services chief economist Tom Kontos didn’t quote A Tale of Two Cities in his latest commentary about the wholesale market.
But Kontos did make a play on words similar to the novel by Charles Dickens, saying “the tale of two markets resumed in March.”
According to ADESA Analytical Services’ monthly analysis of wholesale prices by vehicle model class, Kontos indicated wholesale prices in March averaged $10,904 — up 2.0 percent compared to February and up 1.0 percent relative to March of last year.
Kontos noted that all but one model class segment (compact pickups) showed month-over-month increases. He reiterated the year-over-year growth in minivan prices is exaggerated by newer models as discussed in January’s report.
The reason for saying March was a “tale of two markets,” Kontos explained in his latest Kontos Kommentary released on Thursday that wholesale prices were below year-ago levels for cars and above prior year for trucks.
“Nevertheless, both groups showed price increases versus February’s unseasonably soft results, as retail sales and wholesale activity showed signs of the traditional spring/tax season market typical for used vehicles,” he continued.
Kontos elaborated about the wholesale market by going back to another of his descriptive words that a good author might use — bifurcated. He use the word meaning a split into two branches to reflect back on nine years ago when $20 often did little to move the needle on your vehicle’s gas gauge.
“In analyzing the current bifurcated market, it seems timely to revisit a study begun during the first episode of $4 gas in 2008, when truck prices softened dramatically and car prices rose,” Kontos said. “At that time, the price gap between full-size SUVs and compact cars had fallen from close to $13,000 in January of 2000, when SUVs were all the rage, to $2,162 in June of 2008, when gas prices hit $4 a gallon.
“In other words, dealers were paying high prices for small cars and low prices for big SUVs at that time, narrowing the price gap between the two,” he continued. “That turned out to be the all-time low for this price gap, which gradually rose to $8,293 by November 2016, as gas prices have fallen and the popularity of SUVs has recovered.
“Per our March data, this gap has dropped to $6,675, perhaps indicating that SUV prices are moderating and compact car prices are recovering,” Kontos went on to say. “We will monitor this going forward.”
ADESA’s monitoring also showed that average wholesale prices for used vehicles remarketed by manufacturers in March rose 1.1 percent month-over-month but softened 1.7 percent year-over-year.
Analysts also noticed prices for fleet/lease consignors climbed 3.8 percent sequentially and 0.8 percent annually.
ADESA went on to point out average prices for dealer consignors increased 2.7 percent versus February and 1.3 percent relative to March of last year.
Breaking the data down by age, analysts found that prices dipped 2.5 percent year-over-year for current and one-model-year-old units —what Kontos said typically are off-rental units — and 2.6 percent for three-model-year-old units —what Kontos noted as a good proxy for off-lease units.
Based on NADA data, Kontos closed by stating retail used-vehicle sales by franchised and independent dealers jumped 9.3 percent month-over-month and 1.6 percent year-over-year.
He also mentioned March certified pre-owned sales moved up 15.0 percent month-over-month, although they were down 0.3 percent year-over-year from last March’s all-time record levels, according to figures from Autodata Corp.
Kontos discussed the market further in the video available here and at the top of the page.
ADESA Wholesale Used-Vehicle Price Trends
| |
Average |
Price |
($/Unit) |
Latest |
Month Versus |
| |
March 2017 |
Feb. 2017 |
March 2016 |
Prior Month |
Prior Year |
| |
|
|
|
|
|
| Total All Vehicles |
$10,904 |
$10,688 |
$10,793 |
2.0% |
1.0% |
| |
|
|
|
|
|
| Total Cars |
$8,921 |
$8,732 |
$9,078 |
2.2% |
-1.7% |
| Compact Car |
$6,732 |
$6,658 |
$7,050 |
1.1% |
-4.5% |
| Midsize Car |
$8,006 |
$7,942 |
$8,107 |
0.8% |
-1.2% |
| Full-size Car |
$8,346 |
$8,092 |
$7,803 |
3.1% |
7.0% |
| Luxury Car |
$13,235 |
$13,015 |
$13,636 |
1.7% |
-2.9% |
| Sporty Car |
$14,131 |
$13,478 |
$14,517 |
4.9% |
-2.7% |
| |
|
|
|
|
|
| Total Trucks |
$12,825 |
$12,650 |
$12,657 |
1.4% |
1.3% |
| Minivan |
$9,012 |
$9,004 |
$7,939 |
0.1% |
13.5% |
| Full-size Van |
$13,009 |
$12,838 |
$12,769 |
1.3% |
1.9% |
| Compact SUV/CUV |
$10,894 |
$10,733 |
$11,065 |
1.5% |
-1.5% |
| Midsize SUV/CUV |
$11,459 |
$11,319 |
$11,311 |
1.2% |
1.3% |
| Full-size SUV/CUV |
$13,407 |
$13,140 |
$13,372 |
2.0% |
0.3% |
| Luxury SUV/CUV |
$18,343 |
$18,258 |
$18,857 |
0.5% |
-2.7% |
| Compact Pickup |
$8,793 |
$8,818 |
$8,614 |
-0.3% |
2.1% |
| Full-size Pickup |
$16,142 |
$15,796 |
$15,773 |
2.2% |
2.3% |
Source: ADESA Analytical Services.
While noticing that March wholesale prices rebounded by 1.6 percent, the team at NADA Used Car Guide, a division of J.D. Power, is expecting the market to give back much of that gain in April.
According to the latest issue of Guidelines released on Tuesday, NADA UCG indicated that prices of vehicles up to eight years in age are expected to decline by approximately 1 percent in April. Analysts explained that mainstream car depreciation is expected to be less than last year as compensation for February’s depressed result.
“Conversely, SUV and truck depreciation is expected to be slightly worse due to ongoing increases in supply,” the report said. “Premium segment losses are forecasted to average less than 1 percent, which is about a 0.5-point improvement from April 2016.”
Looking out further, NADA UCG projected that prices are expected to fall by about 2 percent in both May and June before prices deteriorate “slightly more” in the summer and early fall months.
The report went on to mention the overall forecast for the year remains unchanged. Analysts said prices are still expected to decline by about 6 percent in 2017, which is two points worse than the 4 percent softening they noticed a year ago.
More details about March price movement
After declining by an unexpected 1.4 percent in February, NADA UCG reiterated wholesale prices of used vehicles up to eight years old bounced back in March.
Analysts acknowledged this March’s 1.6-percent lift in prices “wasn’t quite as big as anticipated, it was directionally right in line with the period’s 2.3 percent average over the previous three years.”
NADA Used Car Guide’s seasonally adjusted used-vehicle price index fell for the ninth straight month, declining a slight 0.3 percent from February to 110.1 in March. Even though the decline was described as “mild,” the report noted March’s index figure was 7.2 percent below the reading on March of last year, which was 118.6.
The latest reading also marked the index’s lowest level since September 2010.
“March’s recovery in used-vehicle prices can be credited to typical spring season increases, which hinge largely on federal tax refunds,” the report said.
“In March’s edition of Guidelines, we pointed out the negative effect of new laws involving the Internal Revenue Service (IRS),” analysts continued. “Essentially, the laws require the tax agency to withhold all refunds that claim the Earned Income Tax Credit (EITC) and the Additional Child Tax Credit (ACTC) until mid-February.
“As a result of meeting this new process, the delay of tax refunds decreased the amount of vehicle purchases for the month, effectively depressing vehicle prices,” they went on to say.
While the number of tax refunds issued continue to lag last year’s figures, NADA UCG pointed out the situation improved significantly in March. Per the IRS, the total number of refunds issued through March 24 was still 3.4 percent lower than the same period in 2016.
While the total number of refunds was down for the year, the amount issued improved by 7.6 percentage points compared to what was reported through Feb. 24, according to IRS information.
Additionally, the IRS data showed the average refund paid out through March 24 reached $2,897, an amount 1.1 percent higher than the same period in 2016.
Larry Dixon, executive analyst at J.D. Power Valuation Services, elaborated about the impact of tax season in a video available here as well as at the top of this page.
The latest installment of Guidelines also highlighted that mainstream used-vehicle segments recovered from February’s unusually soft performance with prices up virtually across the board.
Normal for the period, NADA UCG found that segment level prices in March were especially strong for non-luxury small and mid-size cars.
“Consumers shopping for vehicles in these segments were finally armed with fresh disposable income thanks to their recently acquired tax refunds, which logically played a role in increasing used-vehicle demand over the month,” analysts said.
After declining by 2.1 percent in February, the report showed subcompact car prices rebounded by 3.4 percent, which was the most of any segment for the month.
Analysts added that prices for compact and midsize cars trailed further behind, but still increased by 2.6 percent, respectively.
Matching the industry average, NADA UCG pointed out that midsize van prices jumped by 1.6 percent, followed closely by the large car segment’s 1.5 percent increase.
Remaining non-luxury segment prices increased between 0.6 percent (large pickup) to 1.4 percent (mid-size utility), according to the report, which also stated large utility vehicle prices were flat for the month.
Closing out that monthly update, NADA UCG found that luxury vehicles fared far worse in March than their non-luxury counterparts. As a result, the report showed four out of six luxury segments experienced price losses for the period.
Analysts said declines were the most severe for luxury large utility and luxury large cars. Prices for the two fell by 1.5 percent and 1.4 percent, respectively.
The report also mentioned luxury midsize and luxury compact car declines reached 0.8 percent and 0.7 percent. Meanwhile, luxury compact and luxury mid-size utility prices ticked up by 0.2 percent and 0.3 percent, respectively.
“Overall, luxury segment losses were more severe than what has occurred during March over the past few years,” the report said.
Black Book’s latest recap of bidding activity and price movement showed how aggressively dealers are getting in the lanes either in person or online.
As certain units kept auction ringmen busy, the Black Book Market Insights report indicated 13 out of the total 22 vehicle segments saw an increase in average value.
On the other hand, editors found that the segment with the weakest retention was the sub-compact luxury crossover/SUV, which declined in value by 0.50 percent.
“Sentiment was positive in the auction lanes with most locations experiencing high sale percentages. This higher demand resulted in increased values in most segments last week,” said Anil Goyal, senior vice president of automotive valuation and analytics.
Before going into how dealers behaved, Black Book recapped its volume-weighted data, which showed overall car segment values increased by 0.10 percent last week. In comparison, the market showed similar performance increasing on average by 0.15 percent in the previous three weeks.
All car segments except luxury and premium showed an increase in values, according to editors, which pointed out that the sub-compact car and sporty car segments gained the most at 0.37 percent and 0.49 percent, respectively.
Again volume-weighted, Black Book determined overall truck segment values — including pickups, SUVs and vans — edged up slightly by just 0.05 percent last week. In comparison, editors mentioned truck values depreciated by 0.06 percent during the previous three weeks.
Black Book went on to mention minivan was the best performing segment, whereas sub-compact luxury crossover declined the most among truck segments.
And now those recaps from Black Book personnel stationed at about 60 auctions each week. The most colorful assessment came from North Carolina as the lane watcher reported back saying, “It is amazing how high dealers will bid to obtain the front-line ready inventory that they need. If it is a clean low-mile unit, look out.”
In New Jersey, a similar situation unfolded as Black Book’s representative said, “The auction this week was the best it has been in several months. Anything under $10,000 with curb appeal was especially strong.”
Next door in Pennsylvania, dealers walked the lanes or watched their screens. “Lots of people on the lanes and bidding online today. The dealer lanes I watched were experiencing very high sales percentages and the money was strong,” Black Book’s watcher in the Keystone State said.
Action was active down in Texas, too, with the recap mentioning, “Seemed like the lanes were much busier this week with a lot of strong sales.”
The last two reports Black Book shared came from Ohio and California, where the situation in the Buckeye State was, “Full-size trucks were selling very well with the bids closing out where they should. Average vehicles bringing average values.”
And out West, “Prices were up today. Most of the dealers I spoke with are short on cars for retail.”
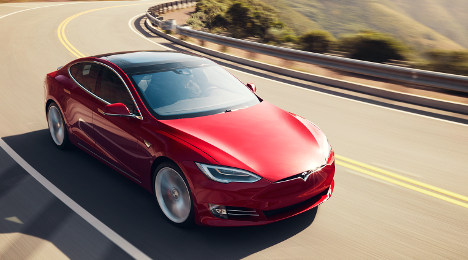
Pre-owned Tesla Model S vehicles sell notably faster than some of its U.S. counterparts’ best-selling used models, according to Autolist.
The firm recently released a study that delved into used Tesla vehicles’ overall market performance relative to those of General Motors and Ford.
The pre-owned Model S averages 87 days on market, 5 percent below its peer group, reports the buyer intelligence firm’s study titled, Changing of the Guard: Tesla vs GM & Ford. That peer group includes the Audi A7, Porsche Panamera, BMW 6 Series, Mercedes-Benz CLS, and Lexus LS 460.
The top used models from GM and Ford — the Ford F-150, Chevrolet Silverado 1500, Chevrolet Malibu and Ford Fusion — spent between 88 days and 104 days on the market.
Additionally, the Model S also has higher pre-owned prices relative to expectations than top-performing GM and Ford vehicles.
Prices of the Model S have trended between 3 percent and 5 percent above expectations for the past year.
Meanwhile, prices for the top-performing used GM and Ford models have trended within 1 percent (above or below) expectations throughout the past year,
To compile this study, Autolist’s analysts took a look at more than 10 million vehicles from April 2016 to January.
“One thing important to understand about our study is — why we think its impactful — is because it’s a comparison relative to a peer group. And that’s a really important element of this analysis because if you’re just comparing raw numbers overall, you can control a cross segment,” Alex Klein, vice president of data science at Autolist, said in a phone interview with Auto Remarketing.
“But what this is really about is … Tesla’s performance relative to its competitors and Ford and GMs performance relative to its competitors. And when you think about things through that lens, that is really what drives brand perception, market value, investment financials, and so on and so forth.”
With the next Tesla model — the Model 3 — set to debut later this year, Klein said the brand's performance in coming years could be determined by the reception of this model, which would be its first mass-market vehicle.
“They have thus far just been a luxury market loyalty group,” he said. “And so when you introduce a mass-market vehicle at scale, there are a lot of potential benefits to getting more people involved with what is an incredible brand at a baseline level.”
According to a J.D. Power report released last month, drivers who purchase the brand’s lowest-price sedan are less likely to be comfortable with any technology-related snags.
Klein said, “Getting the Model 3 involved will get more people to engage with the Tesla brand and could potentially even further accelerate their performance relative to competitors as more car buyers are able to move from a traditional petroleum powered car to an electric vehicle.”
He said Tesla customers are likely to become interested in buying EVs over the long-term, which again has benefits for Tesla, but could also have benefits for other EVs on the market in the future, too.
“When you are buying a Tesla you are buying a next-generation automobile. There’s a perception that people are pushing the bounds of technology and they are being part of the forerunners of next-generation technology whenever they step foot in a Tesla,” Klein added.
More info on the study can be found here.
Perhaps showing the roots of a prolonged trend, Black Book reported that its latest Used Vehicle Retention Index — calculated using the company’s published wholesale average value on two- to six-year-old used vehicles as percent of original typically equipped MSRP — stood at 113.0 at the end of March.
The reading represented a 0.8-percent decrease from the previous month’s mark of 113.9.
Black Book explained that rising interest rates and auto finance delinquencies have led to a slight tightening of credit availability. Editors also pointed out that new-vehicle incentives continue to increase, and certified pre-owned growth has continued to slow, all creating downward pressure on retention values, resulting in a continued easing downward of the monthly Index.
The index is weighted based on vehicle registration volume and adjusted for seasonality, vehicle age, mileage, condition and inflation.
Two individual segments showed significantly higher drops according to their index calculations. They included sub-compact cars (down 2.2 percent) and compact crossovers (down 1.6 percent).
“We are continuing to see that the market is steadily declining, and a typical four-year-old vehicle is not retaining the same value over time,” said Anil Goyal, senior vice president of automotive valuation and analytics for Black Book.
“Given the direction of supply, demand, incentives and interest rates, we feel this easing downward trend for the index will continue throughout the balance of 2017,” Goyal continued.
The index dates back to January 2005, where Black Book published a benchmark index value of 100.0 for the market. During 2008, the index dropped by 14.1 percent while during 2016, the index by softened by 6.4 percent.
During 2011, the index rose strongly from 113.3 to 123.0 by the end of the year as the economy picked up steam and used vehicle values rose higher. It continued to remain relatively stable, rising slightly till May of 2014 when it hit a peak of 128.1. That being said, the index has fallen steadily since May 2015, when the Index registered a score of 125.9.
Black Book reiterated this recent trend illustrates a continued, slow weakening of the used-vehicle market as a result of cresting demand and increased supply in the used market.
To obtain a copy of the latest Black Book Wholesale Value Index, go to this website.
Perhaps with Passover and Easter at hand, the spring market truly is happening if the latest information contained in the latest Black Book Market Insights report is an indication.
The report released on Tuesday showed the car segment as a whole increasing its value by 0.15 percent. Although the truck segment did not retain or increase its value, editors pointed out it was not far behind, only depreciating by 0.04 percent.
Black Book highlighted that two vehicle segments — compact cars and full-size pickups — performed the best this past week, increasing their values by 0.41 percent and 0.43 percent, respectively.
“Entry-level cars show seasonal strength in value, driven by demand from tax season buyers, while the luxury segments show some weakness. Pickups are also seeing renewed improvement in values,” said Anil Goyal, senior vice president of automotive valuation and analytics at Black Book.
Volume-weighted, editors reiterated that overall car segment values increased by 0.15 percent last week. In comparison, the market showed similar performance increasing on average by 0.15 percent in the previous two weeks.
Black Book determined the compact car, sub-compact car and sporty car segments gained the most by 0.41 percent, 0.25 percent and 0.26 percent, respectively.
Again volume-weighted, editors noticed overall truck segment values — including pickups, SUVs and vans — edged lower by just 0.04 percent last week, less than the depreciation rate of 0.07 percent spotted during the previous two weeks.
Black Book indicated the full-size pickup, small pickup and minivan segments ticked up the most by 0.43 percent, 0.28 percent and 0.16 percent, respectively.
Turning next to Black Book’s representatives in the lanes, reports back to headquarters covered the spectrum.
First out in California, the watcher said, “Lots of action; almost everything seemed to be selling well with trucks and SUVs leading the way.”
Next door in Nevada, a similar scene unfolded as Black Book heard: “Dealers are trying to keep their lots full with a lean toward older, lower-price vehicles.”
And continuing out West, the report out of Colorado was, “Good sale but short on vehicles this week. The vehicles that were there sold well however.”
In the Southeast, dealers appeared to back off a bit. In Georgia, Black Book’s auction visitor said, “Inventory and attendance was way down, but prices were stable overall.” And in Florida, the report indicated, “Sellers were holding out for higher bids today, creating more no-sales.”
The last two auction recaps came from the Midwest and Northeast. In Michigan, Black Book’s representative gathered an inkling about how units are turning by reporting, “Dealers are saying that late models are under pressure in the retail world, but the market seemed to stabilize at the auction today.”
And over in Pennsylvania, the action was, “Most of the buying at the high-line sale was done online, while the regular sale was a stark contrast with crowded lanes. Sales percentages were good for both sales.”
Apparently used-vehicle price watchers came to Cox Automotive chief economist Tom Webb in great numbers with a good bit of confusion about reported trends so far this year.
As a result, Webb spent a good portion of his final quarterly conference call this past Friday explaining why the Manheim Used Vehicle Value Index showed only modest price softening earlier this year while other measurements — in particular the NADA Used Car Guide’s seasonally adjusted used-vehicle price index — fell for the eighth straight month and at much greater rate.
Adding fuel to Wall Street observers’ concerns was other finance companies and automakers recently stating that used-vehicle values softened by figures much greater than Manheim’s reading as well. Webb added a new slide to his quarterly presentation to show the Manheim Index and the one posted by NADA Used Car Guide actually moved along similar paths for more than four years.
“Everybody has asked me why the divergence from the Manheim Index? My short answer is that the indices are measuring very different things,” Webb said. “As such, the real question is not why they are diverging now but why did they track in the past?”
Webb went into deeper explanation of the two wholesale price reports, emphasizing that he couldn’t find NADA UCG’s “full explanation of methodology,” of how the team compiles its index. Webb did make a reference to the blog post NADA UCG offered here.
“But a couple of things are obvious,” Webb said. “They note that they are eliminating the effect of new-vehicle pricing increases for the most part. Thus, no upward drift over time unlike our index. Fair enough. But their history seems somewhat at odds with that.
“If their index is really measuring something akin to a residual performance index, then even after the collapse in February, their index reading of 110.1 would suggest that even current residual performance is stronger than at any point between August 1996 and July of 2010, according to their index,” he continued. “That seems somewhat hard to believe.
“Likewise their index peaked in May 2014, again somewhat odd. Everyone knows in 2011 was one of the strongest periods ever for used-vehicle pricing. Supplies were at an all-time low and retail demand was rapidly accelerating. Then to top everything off, we had the Japan earthquake in May, which had a very big impact on late-model used-vehicle pricing,” Webb went on to say.
“I might note that our index even with its inherent upward drift peaked in May 2011,” he added when the index hit 127.8.
Webb also was unsure why NADA UCG leveraged what he deemed to be expected depreciation and “normal seasonal patterns.” He acknowledged the depreciation component is an element federal officials at the Bureau of Labor Statistics use to compute the Consumer Price Index (CPI) for used vehicles
“As to quote expected or assumed seasonal patterns, why not use just a pure statistical routine? If you look at their February seasonals on their website, does it make any sense to average that? Clearly there is a trend that should be taken into consideration,” Webb said.
Webb also mentioned that NADA UCG limits its analysis to vehicles 8 years old and younger. He insisted the impact “is minimal” on the Manheim Index that has no age restriction.
“In February of this year, 27 percent of our sales were from the 2008 model year or earlier. Their actual impact on the index is far, far less than that given the substantially lower price point,” Webb said. “And furthermore generally speaking, older vehicles show more stability in pricing and in a direction that generally comports with the overall market.
“Again, I’m hampered by a lack of detail as to their methodology,” he continued. “I assume they’re using model-year designation as their measurement of age. But when do you throw out a whole model year from your sample? On Jan. 1? July 1? Or some traditional model year change over day in September or October? We don’t know.”
Webb closed the topic by emphasizing that his explanation was not intended to “denigrate their index.”
He added, “We are measuring different things. Each has its purpose and, of course, we have been totally transparent in what we are doing.”
Further price speculation
The differential between expert analyses of used-vehicle prices also triggered some professionals in the investment community to wonder if a “doomsday” scenario might be on the horizon. One call participant asked Webb if used-vehicle prices could drop by double digits in the coming months — perhaps even as much as 50 percent.
The concern also stemmed in part because wholesale supply is on the rise, too, sparked in part by off-lease units coming down the lanes.
Webb pointed out the most significant price decline came during the worst part of the Great Recession. That’s when the Manheim Index dropped below 100 for the first time since a couple of months after its inception in January 1995.
“The possibility of it happening just because of rising wholesale supply is pretty unlikely. Certainly it’s possible, but I just don’t see how some of these other scenarios play out, especially when you go to an extreme and say a 50-percent decline in used-vehicle values,” Webb said.
“How does that play out into everything else? I mean if used-vehicle prices decline by 50 percent, this industry is not going to sell any new vehicles,” Webb continued. “If you can get a very nice used vehicle for $30,000 and then get it for $15,000, people would flock to that market. It doesn’t in my mind comport with reality. There is always going to be some differential in play between the new- and the used-vehicle market just as there is a play between a 2-year-old vehicle and a 6-year-old vehicle. You’ve got to keep some relationship. They might widen or narrow depending on what’s going on, but there is going to be that relationship.
“New-vehicle prices are not going to go into free fall. So if you had a free fall in used-vehicle prices there would be a tremendous shift in terms of where people are buying, which in turn would drive used-vehicle prices back up,” Webb went on to say.
During his last quarterly conference call on behalf of Cox Automotive, chief economist Tom Webb on Friday covered a wide range of used-vehicle topics, including an update on the Manheim Used Vehicle Value Index.
Webb explained that wholesale used vehicle prices (on a mix-, mileage- and seasonally adjusted basis) declined 0.5 percent in March, relative to February. The dip brought the index reading to 124.1, which represented a 1.3-percent increase from a year ago.
“Naturally, wholesale prices were up in March relative to February before the seasonal adjustment,” Webb said.
“On a year-over-year basis, the same story holds: All car segments down, all truck segments up,” he continued.
Specifically, Manheim reported that pickup prices led the way with a 6.7 percent rise year-over-year, followed by van prices at 3.9 percent and SUV/CUV prices at 1.4 percent.
By edging only 0.9 percent lower year-over-year, Webb pointed out prices for compact cars “showed some relative strength.” The two other vehicle segments Manheim tracks each month — midsize cars and luxury cars — both produced price softening at about the same reading at 1.6 percent and 1.8 percent, respectively.
“Although used-vehicle values have declined in five of the last six months, it has not been the collapse that many analysts have warned of for more than a year due to increasing wholesale supplies,” Webb said.
“And, in fact, what weakness we have seen is probably more a result of excessive new-vehicle inventory, not used,” he continued. “At retail, the used-vehicle market remains healthy, and dealers have needed only a modest decline in auction pricing to maintain acceptable inventory turn rates.”
About his retirement
Cox Automotive announced back on March 30 that Webb would be retiring this year, officially departing the company on June 30. Before taking questions for nearly an hour on Friday, Webb expressed gratitude for individuals and companies involved in his professional career that dates back to the 1970s.
“As many of you know, I will be retiring shortly from Cox Automotive. This will be my last quarterly call,” Webb said. “But after following this industry for 43-plus years, it is unreasonable to assume that I can completely go cold turkey, so I look forward to remaining in contact with many of you.
“I also look forward to formally or informally, remotely or in person, to introducing you to the team at Cox Automotive that have been assembled to take over everything I do, plus a whole lot more,” he continued.
“From that perspective, this relationship that we’ve developed over the past 17 years with Manheim, the sharing of insights and opinions, has truly been mutually beneficial, and I hope you feel the same,” Webb went on to say.
After tackling questions about off-lease volume, rental-risk units and more, Webb reiterated his appreciation at the close of Friday’s conference call.
“Technically the next call should be July 10. And as I said, I won’t be hosting that call, but I might listening in. They might even let me ask a question,” Webb said, almost chuckling. “Thank you again for your insights and friendship.”
Editor’s note: Webb covered several segments of the used-vehicle industry during his final conference call with Cox Automotive. Look for more of Webb’s analysis and commentary contained in upcoming reports from Auto Remarketing, SubPrime Auto Finance News and BHPH Report.