Prices of used vehicles from model years 2011-2015 depreciated by an average of 2.9 percent in October — steeper than the average 2.3 percent depreciation seen in September.
According to Black Book, domestic cars are exemplifying ramped-up depreciation that is typically seen going into the fourth quarter. During the last three months, domestic cars have dropped nearly 10 percent in value, averaging more than 3 percent per month.
Year-over-year, domestic cars are down 18.2 percent.
Overall, cars saw lower retention in October, finishing the month down 3.2 percent, compared with 2.6 percent in September. Year-over-year, car segments as a whole were down 19.2 percent last month.
Trucks, meanwhile, finished the month down 2.6 percent. Year-over-year, truck segments as a whole were down 15 percent last month.
And all vehicles are averaging 12-month depreciation of 16.8 percent.
“We expect pockets of vehicles to see accelerated depreciation as the year comes to a close,” said Anil Goyal, senior vice president of automotive valuation and analytics for Black Book. “Most car segments certainly fall into this category, but we’ll be paying special attention on those truck and utility segments that begin to show higher depreciation.”
Compact cars saw the highest monthly drop in value, down 3.6 percent. Vehicles in this segment, which include Honda Accord, Ford Focus and Hyundai Elantra, finished October averaging $8,393, a 19.8-percent drop from a year ago.
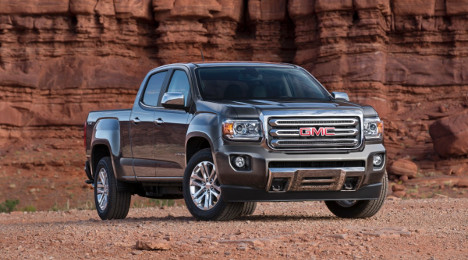
Small pickups, meanwhile, saw the strongest retention, dropping 0.6 percent from September. Vehicles in this segment, which include Toyota Tacoma, Nissan Frontier and Chevrolet Colorado, finished October averaging $19,383, an 8.1-percent drop from a year ago.
After a spate of no-sales two weeks ago, lane watchers from Black Book reported more robust conditions at auctions throughout the U.S. last week.
“Sales were better today than last week, with units $12,000 and under selling the best,” said one in Tennessee.
Also in this week’s Market Insights report, a Black Book rep in Pennsylvania reported a “steady market” with domestic trucks selling the best, and one in Illinois said activity and prices were up over the prior week.
An auction spotter in Washington said that “there was more available volume today, but the market has gotten softer here.”
And in Texas, a rep did report “lots of no sales today in the dealer lanes, but the lease lanes performed well.”
Depreciation ramps up
Heading into the fourth quarter, both cars and trucks saw steeper price declines last week compared to the previous four weeks.
Volume-weighted, overall car segment values decreased by 0.80 percent, higher than the depreciation rate of 0.69 percent seen in the previous four weeks.
Truck values, meanwhile, decreased by 0.76 percent, which was higher than the depreciation rate of 0.57 percent seen in the previous four weeks.
Among the former category, midsize cars and sporty cars declined the most, by 1.20 percent and 0.88 percent, respectively.
Among trucks, most crossover SUV segments declined in value, with full-size crossover values dropping the most by 1.12 percent.
“Typical seasonality trend of the higher depreciation in the fourth quarter continues,” said Anil Goyal, senior vice president of automotive valuation and analytics for Black Book. “Crossover/SUV values, which have been strong all year, are also starting to see steeper declines.”
Past seasonality trends show that vehicle depreciation tends to be highest during the fourth quarter. This year appears consistent with that trend, except that the retention values for 2-year-old vehicles are lower this year than the trends in the previous four years.
RVI Group’s latest Market Update reveals that all vehicle segments saw used-car price declines in September as compared to a year ago.
As a result, the RVI Used Vehicle Price Index decreased by 0.5 percent when compared to August. Compared to a year ago, the index was down by 4.3 percent.
Adjusting for inflation, the index decreased by 0.3 percent in September, and was down by 2.2 percent year over year.
RVI’s Used Vehicle Price Index, which started at 1.0 in January 2001, measures wholesale values of used cars 2 years old to 5 years old adjusted for mileage, mix and seasonality. The index in September was at 1.046.
Used prices for small vehicle segments continue to be below market average due to the effect of low gas prices, which are down 5.5 percent year over year.
Subcompact cars prices are down 9.1 percent year over year, followed by compact cars (8.2 percent), small sedans (7.8 percent) and sporty coupes (7.0 percent).
Minivans saw the best retention, with prices down 0.2 percent year over year, followed by small pickups (1.8 percent).
But small pickups saw the highest monthly price drop, with prices down 2.6 percent over August.
Meanwhile, new-vehicle prices decreased 0.1 percent in September compared to a year ago. New-vehicle prices (transaction prices), on a seasonally adjusted basis, fell by 0.1 percent from August to September.
When it comes to maintaining auction values, the story during the third quarter was pickups, pickups, pickups.
According to the latest Blue Book Market Report from Kelley Blue Book, the segment of 1- to 3-year-old vehicles with the best performing auction value was the full-size pickup, whose prices softened just 0.6 percent. Second was the midsize pickup truck (down 0.9 percent).
On a brand level, RAM was the only one that showed growth in auction value during the quarter, climbing 3.1 percent.
And on the list of 10 best-performing models, pickups claimed the top three spots: GMC Canyon Crew Cab (up 3.2 percent) in first, followed by the GMC Sierra 1500 Extended Cab (up 2.8 percent) and the Chevrolet Silverado 1500 Extended Cab (up 2.8 percent).
So why have pickup truck values been so strong? KBB analyst Sean Foyil pointed to several reasons in comments emailed to Auto Remarketing.
“First and foremost, fuel prices are still relatively low, coupled with the fact that trucks are becoming more efficient (for example: Ford F-150’s EcoBoost motor or GMC/Chevrolet’s 2.8L 4 cylinder turbo diesel),” Foyil said.
“Also, the midsize truck segment is full of all-new and new generation vehicles which are helping to keep values up for the segment. Demand is also definitely a factor,” he said. “We’ve consistently received feedback from our field analysts that demand for trucks in the auction lane has been very strong.”
Several auction sites throughout the U.S. had a tough week last week, according to Black Book’s weekly Market Insights report.
A Black Book auction spotter in Texas bemoaned sluggish conditions in that market. “Even trucks were slow today, which is uncommon here,” he said.
In Florida, a Black Book rep reported lots of no sales in the rental and lease lanes, with sellers struggling to get the prices they wanted.
Things were much the same in Tennessee, where “a lot of no sales” made for a tough day for dealers.
Elsewhere in that state, a lane watcher observed “a lot of no-sales in the high line lanes today but the overall market trend is still good.”
Things were sunnier in California, where there was “plenty of consignment … with pickups and SUVs leading demand.”
As far as used-vehicle values, car segments depreciated at a slower rate (0.57 percent) last week than the rate of 0.72 percent seen in the previous four weeks (volume-weighted).
Compact cars, sporty cars and subcompact cars declined the most at 1.22 percent, 1.06 percent and 0.86 percent, respectively.
“Small cars continue to experience higher depreciation levels. Sporty cars have shown high declines in the last four weeks, in line with the seasonal trend,” said Anil Goyal, senior vice president of automotive valuation and analytics at Black Book.
Volume-weighted, truck segments declined by 0.36 percent, lower than the depreciation rate of 0.58 percent seen in the previous four weeks.
Compact vans and compact luxury crossovers/SUVs declined the most by 1.65 percent and 1.32 percent, respectively.
The report noted the gas prices have remained stable during the past six months at around $2.30. Prices during the past 12 months, meanwhile, have been lower than during the previous year.
NADA Used Car Guide’s seasonally adjusted used-vehicle price index fell by 1 percent in September, bringing it to its lowest level since March 2011, according to its latest Guidelines report.
Here’s what happened last month: Wholesale prices of vehicles up to 8 years old fell by 3.6 percent. While in line with predictions, it was the largest monthly decline thus far in 2016.
Price movement was led by small cars. Subcompact and compact car prices fell by 4 percent each — similar to the previous combined three-year average of 4.3 percent for the period. And large cars saw a loss of 3.7 percent, also in line with the segment’s prior three-year average.
Other mainstream segments fared better than average. Midsize car and utility losses were 3.5 percent and 3.4 percent, respectively. Losses for these segments during the previous three Septembers averaged 3.7 percent and 3.1 percent.
Compact and large utilities saw smaller monthly losses, at 3.2 percent and 3 percent, respectively. While lower than the industry average, these losses were higher than the prior three-year average for the segments.
Pickup truck price losses were notably light in September. Midsize pickup price losses were 1.6 percent, while large pickup prices fell by 1.3 percent. Over the previous three years, losses for both of those segments averaged 2.1 percent, which NADA Used Car Guide pointed out was low when looking at the big market picture.
Losses for luxury segments were mixed, but were all within a half point of the industry average. That being said, losses here were higher than the previous three Septembers.
Looking at things from a year-to-date perspective, the used-vehicle price index sits 3.6 percent below last year’s nine-month average. Used vehicle prices were 14.9 percent lower through September relative to all of 2015.
Depreciation among mainstream segments this year has been led by subcompact cars, whose prices have fallen by an average of 23.2 percent year to date.
And while truck and utility depreciation is rising, it’s still milder compared to cars. Midsize pickup prices were down by 7.8 percent through September, while large pickup and large utility prices fell by 7.7 percent and 7.1 percent, respectively.
Losses in luxury segments ranged from 14.2 percent to 17.9 percent. Large utilities were the only segment to perform better relative to 2015. Prices fell by 7.1 percent through September, compared to 8.7 percent during the same period last year.
NADA Used Car Guide predicts that prices of vehicles up to 8 years old will fall by 3.2 percent to 3.7 percent in October relative to September. This is more than the 2.7 percent decline averaged for the month in 2015.
Looking ahead, monthly losses are expected to be softer for the rest of the year. As a result, NADA Used Car Guide’s full-year forecast has prices down by an average of 4 percent on an index basis from 2015.
If dealers noticed they were paying about the same figure for a vehicle in September as they did in August, the latest data from ADESA Analytical Services indicated that was, in fact, the case.
According to ADESA’s monthly analysis of wholesale used-vehicle prices by vehicle model class, wholesale used vehicle prices in September averaged $10,734, which was flat compared to August. But the reading represented a 5.1-percent increase relative to September of last year.
ADESA explained average prices for cars were up modestly on a year-over-year basis (0.3 percent), while truck prices were up significantly (7.3 percent), driving the overall year-over-year increase.
“Particularly hard-hit during the month were midsize cars, while luxury cars had a nice bounce. Minivans also saw solid price growth during the month,” ADESA chief economist Tom Kontos said in his monthly commentary that accompanied the price data.
“Average wholesale values were flat in September, but remained up on a year-over-year basis primarily on the strength of truck prices and a higher proportion of pricier off-lease units,” Kontos continued. “Retail used-vehicle sales, including CPO sales, were relatively weak, though both remain up for the year.”
ADESA indicated average wholesale prices for used vehicles remarketed by manufacturers moved 1.6 percent higher month-over-month and 7.1 percent higher year-over-year.
The company also said prices for fleet/lease consignors softened 1.0 percent sequentially but climbed 1.0 percent annually.
Furthermore, ADESA noticed dealer consignors registered a 2.0-percent average price decrease versus August but a 4.3-percent increase relative to September of last year.
Kontos closed his update — which also can be watched at the top of this page or by going here — with sales data from the National Automobile Dealers Association.
NADA reported franchised dealers saw a 9.4-percent month-over-month decrease in retail used-vehicle sales, while independent dealers registered a 3.1-percent sales loss. For the year, however, retail used-vehicle sales are up 5.0 percent.
“September CPO sales were down 1.4 percent year-over-year and down 10.8 percent month-over-month, according to figures from Autodata,” said Kontos who is among the experts coming to Used Car Week at the Red Rock Resort and Casino in Las Vegas on Nov. 14-18. “For the year, however, sales have already topped the 2-million mark and are up 3.7 percent.”
ADESA Wholesale Used-Vehicle Price Trends
| |
Average |
Price |
($/Unit) |
Latest |
Month Versus |
| |
Sept. 2016 |
August 2016 |
Sept. 2015 |
Prior Month |
Prior Year |
| |
|
|
|
|
|
| Total All Vehicles |
$10,734 |
$10,738 |
$10,218 |
0.0% |
5.1% |
| |
|
|
|
|
|
| Total Cars |
$8,666 |
$8,675 |
$8,638 |
-0.1% |
0.3% |
| Compact Car |
$6,497 |
$6,597 |
$6,575 |
-1.5% |
-1.2% |
| Midsize Car |
$7,520 |
$7,748 |
$7,580 |
-2.9% |
-0.8% |
| Full-size Car |
$7,605 |
$7,651 |
$7,553 |
-0.6% |
0.7% |
| Luxury Car |
$13,773 |
$13,356 |
$13,651 |
3.1% |
0.9% |
| Sporty Car |
$13,365 |
$13,605 |
$12,892 |
-1.8% |
3.7% |
| |
|
|
|
|
|
| Total Trucks |
$12,740 |
$12,751 |
$11,878 |
-0.1% |
7.3% |
| Minivan |
$8,386 |
$8,183 |
$7,450 |
2.5% |
12.6% |
| Full-size Van |
$13,551 |
$13,350 |
$13,384 |
1.5% |
1.2% |
| Compact SUV/CUV |
$10,539 |
$10,673 |
$10,257 |
-1.3% |
2.8% |
| Midsize SUV/CUV |
$11,650 |
$11,448 |
$10,266 |
1.8% |
13.5% |
| Full-size SUV/CUV |
$13,268 |
$13,292 |
$12,222 |
-0.2% |
8.6% |
| Luxury SUV/CUV |
$18,595 |
$18,610 |
$18,318 |
-0.1% |
1.5% |
| Compact Pickup |
$8,606 |
$8,485 |
$8,006 |
1.4% |
7.5% |
| Full-size Pickup |
$15,887 |
$16,141 |
$14,847 |
-1.6% |
7.0% |
Source: ADESA Analytical Services.
In a “what comes up, must come down” type of scenario, certain vehicles that have seen fairly good retention thus far in 2016 are starting to see their values drop.
“The truck segments, particularly SUVs and pickups, are beginning to see larger declines after experiencing strong retention so far this year,” Anil Goyal, senior vice president of automotive valuation and analytics for Black Book, said in the latest Market Insights report.
Analysts at Black Book noticed increased depreciation last week for full-size vans, midsize crossover SUVs and full-size pickups. Their values fell by 1.02 percent, 0.75 percent and 0.74 percent, respectively, over the previous week.
Volume-weighted, overall truck segment values for vehicles up to 8 years old decreased by 0.58 percent last week, higher than the depreciation rate of 0.43 percent seen in the previous four weeks.
Overall car segment values, also volume-weighted, decreased by 0.57 percent last week, better than the depreciation rate of 0.66 percent seen in the previous four weeks.
Sporty cars, prestige luxury cars and compact cars declined the most at 1.20 percent, 0.99 percent and 0.82 percent, respectively.
Analysts pointed out that two truck segments — subcompact luxury crossovers and compact crossovers/ SUVs — had the best retention of any car or truck segment last week, with prices dipping by just 0.24 percent and 0.37 percent, respectively.
Going back to full-size pickups, Black Book noted that the retention rate for this segment has been climbing for the past few years, but has dipped by 2 percentage points this year. For 2-year-old model-year 2010 vehicles, retention was 56 percent. For MY 2013, that figure was 66 percent; it’s now at 64 percent for MY 2014 vehicles.
At auctions last week, Black Book editors and personnel reported a range of findings.
The news from grim for a lane watcher in Texas, who noted slow lanes with lots of no sales.
“A tough day to buy or sell,” he said.
An auction spotter in Minnesota said: “Lower volume of vehicles and dealer attendance today but still had strong internet activity on the right vehicles.”
And one in Washington said that many prices seemed to be down, though trucks were still above average.
A Black Book rep in Ohio reported that sedans, SUVs and trucks were in fairly good demand.
Finally, in Michigan: “Very large consignment today with buyers being very picky of what they bid on.”
Cox Automotive chief economist Tom Webb described September’s reading of the Manheim Used Vehicle Value Index, which represented a 1.7-percent lift year-over-year, as “not extremely unusual.”
When Webb hosted his quarterly conference call on Monday, he used a potentially troublesome adjective, “problematic,” when he touched on a figure that might push wholesale prices and the Manheim Index lower.
To recap, Manheim indicated wholesale used-vehicle prices (on a mix-, mileage-, and seasonally adjusted basis) remained unchanged between August and September, but non-seasonally adjusted prices declined 1 percent during the month. As a result, the Manheim Used Vehicle Value Index stood at 126.9 for September, an increase of 1.7 percent from a year ago.
“It’s a little bit better than I expected but not extremely better,” Webb said. “When we do the full-year numbers, I think on an annual average basis the index will show a modest increase, i.e. less than 1 percent, whereas we were expecting a decline of less than 1 percent.”
At least through the first three quarters of the year, Webb acknowledged the used-vehicle retail market “has been better than expected and that’s sort of driving it.” Webb cited data from the National Automobile Dealers Association that has used-retail sales coming in 4.5 percent higher, which “is a big change and very positive.”
And why are franchised and independent dealers turning more used metal?
“The margins have stabilized,” Webb replied.
That assessment prompted participants on Webb’s call to wonder if the retail market can continue to sop up the additional wholesale volume that’s coming, especially as off-lease activity continues to climb because of how much new-vehicle leasing is being originated by captives and other finance companies.
Webb asserted that the 3.1 million off-lease units expected to come down the lanes this year “is not that big of a deal in the grand scheme of things.” But next year’s expectation is for off-lease volume to hit 3.6 million units, which he acknowledged “is a much more problematic number.
“And then an excess of 4 million in 2018, the numbers get real big so you would expect some downward pressure (on wholesale prices),” Webb went on to say.
The Cox Automotive expert, who will be on hand for Used Car Week again this year, also mentioned that new-model leasing might be slowing down a bit from the record-setting pace seen in recent quarters. Webb shared his own estimations that new-model leasing volume is about 8 to 9 percent higher year-over-year through the first nine months of 2016. He added that he doesn’t expect a year-over-year uptick during Q4 because “we pushed out lots of leases last year.”
Webb continued, “The full-year increase is going to be significant but certainly not anything like we saw in previous years. It’s starting to level off also.
“The penetration rates start to level off because many of these lessors only have a certain amount of appetite for the amount of residual risk that they want to hold out there,” he went on to say. “I think they’re pretty well full.
“Certainly to the extent if pricing starts to deteriorate a little bit and you start showing some end-of-term losses, certainly your appetite for creating new leases is significantly less,” Webb added.
Editor’s note: Watch for upcoming reports from Auto Remarketing and SubPrime Auto Finance News for Webb’s assessment of the certified pre-owned market as well as credit availability.
Whether looking from the dealer perspective of used-vehicle prices for units running down the lanes or movements in depreciation that finance companies might consider, neither Manheim nor Black Book spotted dramatic shifts when analyzing their respective September data.
First, Manheim determined wholesale used-vehicle prices (on a mix-, mileage-, and seasonally adjusted basis) remained unchanged between August and September, but non-seasonally adjusted prices declined 1 percent during the month. As a result, the Manheim Used Vehicle Value Index stood at 126.9 for September, an increase of 1.7 percent from a year ago.
“The strength in wholesale pricing is explained, in large part, by current and past increases in new vehicle transaction prices (even after adjusted for mix shifts),” Cox Automotive chief economist Tom Webb said in his commentary that accompanied the latest Manheim Index update.
“For example, the new-vehicle component of the Consumer Price Index (which further includes a quality adjustment) has increased by 1 percent over the past three years, and a straight average of new-vehicle transaction prices is up 9 percent since 2013,” Webb continued.
“As such, wholesale used-vehicle prices relative to new-vehicle prices are not out of line with historic norms,” he added. “Additionally, higher retail used-unit sales and stabilizing margins have kept dealers active bidders in the wholesale market.”
Meanwhile, according to Black Book data, the average price of a used vehicle for model years 2011 to 2015 depreciated by 2.3 percent during September, just slightly better than the August reading of 2.4 percent.
Black Book indicated that overall cars saw lower retention in September, ending the month at a 2.6 percent depreciation rate compared with 1.8 percent in August. Trucks as a whole finished with a depreciation rate of 2.0 percent in September.
Editors added that all vehicles are currently averaging a 12-month depreciation change of 16.6 percent.
“This past month all segments seemed to have retained their values slightly better than they did the previous month,” said Anil Goyal, Black Book’s senior vice president of automotive valuation and analytics. “This is likely due to typical market fluctuation, however it appears as though some truck segments are beginning to feel more depreciation than in recent months.”
Deeper look at Manheim data
Manheim reported that all major car segments posted year-over-year price declines in September, while prices for all major truck segments moved higher.
Within cars, Manheim indicated the sporty segment was up “significantly.” Within the SUV/CUV segment, Manheim noted small entry units were “weak” while dipping by 4.4 percent, while prices for full-size units climbed by 6.5 percent.
Manheim went on to mention a straight average of dealer-consigned units had a 2.7 percent increase in auction prices and a 1 percent decline in average mileage.
Analysts said commercially consigned units had the same 1-percent decline in average mileage, but only a 1.6-percent increase in average selling price. A straight average of all auctions sales showed prices up more than 4 percent as a result of a higher share of commercially consigned units and a richer mix of vehicles.
Sliding over the off-rental market, Manheim explained rental risk offerings have lower mileage, better mix, and higher quality.
The average price of a rental-risk unit sold at auction in September reached a record high of a little more than $17,000.
“That record price was driven by lower mileage and a better mix of vehicles being sold in better condition,” Webb said. “Our index of rental risk pricing adjusted for mileage and broad market class shifts was down 1 percent for the month and year-over-year.
At 37,100 miles, Manheim also mentioned the average mileage of rental risk units sold at auctions was the lowest since November 2013.
“Relative to mix, midsize cars represented a significantly smaller share of September sales. Crossovers accounted for a much higher share,” Webb said.
In the third quarter of this year, Manheim pointed out vehicles with a grade of 4.0 or higher accounted for 42 percent of all rental risk sales. In last year’s third quarter, vehicles in that condition accounted for only 34 percent of sales.
Looking ahead
Using the explanation of the “coming seasonal forces,” Webb closed his examination of the wholesale market with a couple of thoughts.
“The seasonal headwind to wholesale pricing has always been strongest from Labor Day to Thanksgiving,” Webb said. “And, statistics show that the seasonal pressure on wholesale pricing in October has not diminished over the past 20 years, even though new model introductions are increasingly scattered throughout the calendar year.
“Preselling the tax refund season with the use of down-payment deferral programs has, however, made both November and December relatively stronger pricing months than in years past,” he continued. “Indeed, in each of the past three years, November (which had historically been the weakest month for wholesale pricing) was slightly stronger than October, statistically speaking.”