It was status quo for car deprecation last week, while truck values fell at a slower pace than the week prior, according to Black Book’s weekly Market Insights report.
Volume weighted, overall car segment values (models years 2008-2014) decreased by 0.78 percent last week, on par with the previous week’s 0.77 percent, while truck segments prices decreased by 0.32 percent, better than the prior week’s 0.48 percent.
“Wholesale values of car segments continue their decline, now at the fastest pace seen this year, while most truck and SUV segments show stability,” said Anil Goyal, senior vice president of automotive valuation and analytics at Black Book.
Among trucks, subcompact crossovers, small pickups and minivans declined the most by 2.14 percent, 1.22 percent and 0.94, respectively. Meanwhile, compact vans, full-size vans and compact luxury crossover/SUVs saw lower depreciation at zero percent, 0.16 percent and 0.14 percent, resprectively.
Among cars, prestige luxury models, subcompacts and midsize cars declined the most, at 1.02 percent, 0.94 percent and 0.92 percent, respectively. Sporty cars saw the lowest depreciation at 0.48 percent.
The report puts a focus on luxury cars, particularly 2-year-old models. Cars in this class are showing notably weaker retention compared with previous year models in late summer. However, luxury cars (down 0.61 percent) fared slightly better last week compared with other luxury segments.
In general, values of 2-year-old (model year 2014) luxury cars are trending more than 3 percentage points lower than the prior year’s retention for similar vehicles at this point in their life cycle, according to the report.
Sentiment from the lanes
Each week, representatives from Black Book attend dozens of auctions throughout the country. Below are some of their most recent insights.
“Midsize luxury and full-size SUVs were both in demand at today’s sale,” commented a lane watcher in Nevada.
“Buyers looking for low-mileage clean history units at this location,” said a rep in Florida.
In Texas, “trucks are still doing well but cars are still depreciating at a higher rate.”
It was quality over quantity in Tennessee, where there were “not a lot of dealers here today, but those that were came to buy.”
A Black Book rep in Pennsylvania noted, “Not many trucks were available at today’s sale but bidding was strong with a high sales percentage overall.”
Finally, in Michigan: “Retail is still a bit weak around here but is picking up somewhat since school started back.”
As we begin to sense subtle signs of fall in the air, Black Book opted to take a look at which cars and trucks have seen the biggest depreciation at this time of year over the last decade.
According to the analysis, that distinction goes to cars in the prestige luxury segment, followed by a handful of other luxury-type segments.
From 2006 to 2016, prestige luxury cars have had their prices drop an average of 5.63 percent during July, August and September. Last year, prices for this segment dropped 5.9 percent, and in 2009 prices saw their largest three-month plummet (10.6 percent). Vehicles in this category include the Audi A8, BMW 7-Series, Lexus LS/SC, Porsche Panamera, and the Mercedes-Benz 400, 420, 500 and 600.
Luxury car (5.23 percent), full-size luxury CUV/SUV (4.83 percent), and midsize luxury CUV/SUV (4.83) are the segments that have seen the next-highest depreciation entering the fall season.
“Dating back to 2006, we have seen a number of factors contribute to the rise and fall of used-vehicle prices, many of which are supply- and demand-related,” said Anil Goyal, senior vice president of automotive valuation and analytics at Black Book. “When looking at the three-month retention average among all segments entering fall over the last 10 years, many of the hardest-hit vehicles are in the luxury segments, which have struggled with retention strength due to increasing supply levels and higher MSRPs, which can lead to more volatile retention swings during this time of the year.
“What’s more,” he continued, “many of these luxury vehicles are now seeing slightly lower demand as car shoppers look to less expensive non-luxury vehicles that now offer technology and features that rival that of luxury types.”
Full-size pickups (10-year average third-quarter depreciation of 1.67 percent) and small pickups (1.78 percent) have seen the most retention strength in the three months entering fall. Lower supply levels and strong demand over the last several years have been contributing factors.
Overall car values continue to face notably higher depreciation than trucks, according to this week’s Black Book Market Insights report.
Volume weighted, overall car segment values for model years 2008-2014 decreased by 0.77 percent last week, which was significantly higher than the average depreciation rate of 0.48 percent seen in the previous four weeks.
Luxury cars showed the steepest decline at 1.32 percent.
Midsize cars (1.09 percent) and near-luxury cars (0.93 percent) showed the next-highest declines among cars.
Volume-weighted, overall truck segment values decreased by 0.48 percent last week, which was higher than the average depreciation rate of 0.33 percent seen in the previous four weeks.
Compact luxury crossover/SUV, midsize luxury crossover/SUV and full-size luxury crossover/SUV segments declined the most by 1.20 percent, 1.14 percent and 1.01 percent, respectively.
“Wholesale values of car segments declined faster last week, led by luxury cars. Luxury crossover/SUV segments also experienced larger declines,” Anil Goyal, senior vice president of automotive valuation and analytics, said in the report.
The report also takes a look at three-month depreciation trends, which show much variability. At one end of the spectrum were full-size pickups, which were down 1.3 percent, while subcompact car values fell by a high of 7.4 percent from May to August.
Compact vans and luxury cars tended toward the high end of the three-month depreciation scale at 6.6 percent and 6.1 percent, respectively, while small pickups and full-size vans saw milder losses at 1.4 percent and 2.1 percent, respectively.
View from the lanes
Black book representatives shared their insights from auction lanes throughout the U.S. during the past week.
A lane watcher in Tennessee noted an “above average number of low prices here today, (with) dealers saying they are dumping old stock before new-car incentives hit the market.”
Likewise, a watcher in Illinois noted that prices were “down slightly” in that location.
A Black Book representative in Nevada said: “There seemed to be an increased demand for midsize and full-size SUVs here this week,” while one in Michigan noted that “pickup truck prices are back after a couple of soft weeks.”
A lane watcher in Texas observed that “the auction was well-attended today with prices holding steady,” while another in Florida saw “some no-sales today; most were 2015 and 2016 models.”
Finally, in Pennsylvania: “Attendance was down somewhat this week, which created a relatively slow day. Most dealers blame it on the ongoing hot weather.”
Wholesale prices of vehicles up to 8 years old fell by 2.3 percent in July compared to June, tying June for the biggest monthly drop thus far in 2016.
Perhaps not unsurprisingly, losses were steeper for cars than for trucks.
“Price movement at the segment level followed the trend we’ve witnessed the past few months where car losses were greater than trucks,” Jonathan Banks, executive analyst at NADA Used Car Guide, said in the latest Guidelines report.
“Used subcompact car prices fell by an average of 3.9 percent ($371). That’s the largest segment decline this past month," Banks continued.
While that segment’s loss was July’s largest in the industry, it matched the month’s previous three-year average.
Losses for midsize and compact cars were once again larger than the industry average, but typical for the period, NADA UCG noted. Depreciation for those segments reached an average of 2.9 percent, almost in line with last July’s 3 percent decline. Large-car depreciation also was slightly worse than the industry average at 2.5 percent, but better than last year’s 2.8 percent decline.
That being said, large utility and large pickup truck prices showed strength. Prices for those segments fell by 0.3 percent and 0.5 percent, respectively. These figures align with the segments’ previous three-year combined average decline of 0.4 percent.
Prices for other mainstream truck and utility segments were strong, except for midsize vans; prices for that segment fell by 2.7 percent.
Midsize pickup prices slipped by 1.4 percent, while compact and midsize utility prices declined by 1.7 percent and 1.8 percent, respectively.
Luxury segment losses were mixed in July. Small luxury vehicles saw greater losses than midsize and large luxury vehicles for the month. Luxury compact utility prices declined by 3.1 percent, the most of any luxury segment, followed by compact car prices, which fell by 2.7 percent.
As a result of July activity, NADA Used Car Guide’s seasonally adjusted used vehicle price index fell by 1.3 percent to 118.9.
What’s happened year to date
Through July, NADA Used Car Guide’s used-vehicle price index stood 3.6 percent below 2015’s seven-month average. In depreciation terms, used-vehicle prices were 12.5 percent lower through July relative to all of 2015. Last year, depreciation reached a lesser 9.6 percent over the same period.
Subcompact car prices fell the most during the first seven months of this year, dropping by an average of almost 20 percent.
Truck and utility losses were milder, with large pickup prices down less than 7 percent through July, and large utility and midsize pickup prices off by a tamer 5.7 percent and 6.3 percent, respectively.
Depreciation expected to pick up
NADA Used Car Guide’s August forecast has prices of vehicles up to 8 years old falling by 2.5 percent to 3 percent when compared to July. This expected drop is about a half- to one point greater than the 2 percent decline averaged for last August.
Subcompacts are expected to drop by about 3 percent, while compact, midsize and large-car prices should fall by an average of 2.7 percent — similar to last August.
Compact utility and midsize utility depreciation is expected to reach 2.3 percent, while midsize van prices are expected to fall by 2.7 percent. Large pickup and large utility prices should decline by up to 1.8 percent, while luxury segment losses (both car and truck) are expected to average 2.5 percent.
Heading into fall, NADA Used Car Guide predicted depreciation will accelerate as the market enters that is traditionally the softest part of the year. Prices in September and October are expected to fall by about 3.2 percent and 3.7 percent per month.
NADA Used Car Guide’s full-year forecast has prices down by an average of less than 5 percent on an index basis from 2015.
Turns out the color of your car matters more that you might think.
(And no, we’re not talking about the myth that red cars attract more speeding tickets.)
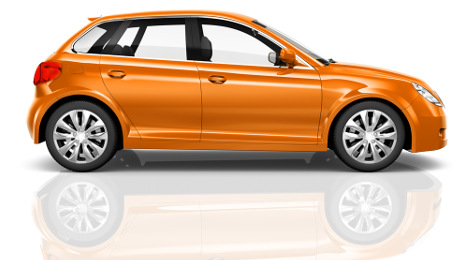
A recent analysis by Boston-based iSeeCars found that the color of a vehicle can affect its retained value. Model year 2013 orange and yellow cars, the research company found, depreciated the least over the first three years of ownership.
While the average car depreciated 29.8 percent over three years, orange and yellow cars depreciated by 21.6 percent and 22 percent, respectively — the least of any color. Green was not far behind at 24.5 percent, making it the third-best color for retained value.
Popular car colors such as black, white and gray, meanwhile, showed depreciation that was closer to the average car (30.2 percent, 29.5 percent and 29.5 percent, respectively).
“Going in, the idea was that perhaps there wouldn’t be any surprises,” iSeeCars chief executive officer Phong Ly told Auto Remarketing. “But it was surprising to see that these unusual colors stood out.”
And, he added, these findings stood up across most body styles and car segments.
What might be at play
Ly posited that supply and demand may play be playing a role.
“The more unusual colors are not as readily available, yet they are popular with enough car buyers to create a demand that directly affects resale value,” he noted when the study was released.
“These brighter color cars make up 1.5 percent of all the cars that are out there,” he subsequently explained. “From a seller’s point of view, there may be more pricing power. From a buyer’s point of view, if that’s what they’re looking for, they may be willing to pay a bit more for it. What’s surprising to me was that these unusual colors didn’t actually take much longer to sell than the average car.”
In fact, while the average 3-year-old vehicle is on the market for 43.9 days, orange, yellow and green cars are on the market for 44.1, 49.5 and 45 days, respectively.
Lower average mileage may also be a factor in higher retained values for vehicles in rarer colors.
“Cars in orange, yellow and to a lesser extent green are primarily sports cars and muscle cars,” Ly said. “Not only do these colors appeal to many of the buyers in these segments, but these cars are driven less, most likely because they are not used as daily drivers.”
For example, the average mileage of a 3-year-old orange sports cars is 27,210; for a muscle car it’s 26,822. This compares to 36,324 miles on average for all cars.
Of note was that gold cars showed the worst three-year depreciation at 33.5 percent, perhaps because gold mostly adorns sedans, which have been falling out of favor in recent years.
While buyers should choose “common” colors if that’s what appeals to them, Ly said they shouldn’t necessarily shy away from less-common hues.
“I think the conventional wisdom out there is that when a buyer is considering a color, they tend to go with the more popular colors with the thought that it might be easier to sell then they need to sell. That is not always the case,” he said.
And while consumers who will be turning in or trading in leased vehicles shouldn’t expect more than the average retained value, Ly said, “consumers who have a car in orange, yellow or green may be able to get more money for their cars, potentially adding to the down payment on their next car.”
Reminder for dealers
So what is the takeaway for those on the selling side of the equation?
“For a dealer, it’s basically that when they buy a car to sell, remembering that color could play a role in the value of that car. For just the average consumer selling a car, I would do a bit more analysis before just saying that ‘I’m selling an orange car or yellow car, it’s not as popular so I’m not going to list it for much.’ Don’t shortchange yourself.”
A note on methodology: iSeeCars analyzed more than 1.6 million used 3-year-old vehicles (model year 2013) sold between July 1, 2015, and June 30. Depreciation over three years was calculated by comparing the average listing price to the average MSRP (inflation adjusted) for each car color, as well as for each color and body style/market segment. Colors with fewer than 1,000 cars, and colors and body styles/market segments with fewer than 30 cars were excluded from the anaylsis.
In the latest installment of the annual Power 300 issue of Auto Remarketing, we go behind the scenes with some of the leading companies in the used-car space and their top executives with a few Q&A features.
Next up in this series is Tony Hughes, the managing director of credit analytics at Moody’s Analytics.
Auto Remarketing: Generally, does the investment community find auto finance more appealing nowadays compared to a year ago or even five years ago? Why or why not?
Tony Hughes: Looking back, 2013 and 2014 were the best recent years. Used car prices were strong, credit was improving and considerable pent-up demand for cars remained after the lingering Great Recession. Much of this demand has now burned off, and we expect auto markets to stabilize for the remainder of 2016 and into 2017.
AR: What’s your general assessment of how the auto ABS market has performed so far this year?
TH: Although we have observed increasing levels of delinquencies and losses, Auto ABS transactions have withstood the weakening collateral performance and underwriting due to strong structural features. Prime and subprime ABS losses have been rising when compared with YTD last year. Subprime Auto ABS has had a mixed performance since ’08, but losses have been rising, year over year, since 2013.
This year has been no exception. As the upward trend has continued, U.S. prime Auto ABS performance has been consistently strong after the financial crisis, with net loss rates below 1 percent and 60-day delinquency rate below 0.6 percent, but these have now also begun to creep up this year, joining the trend in the subprime sector.
Bolstered by continuing low unemployment and historically high used car prices, the credit performance of U.S. auto loan asset-backed securities has been generally strong in 2016. No Auto ABS tranche has experienced a default. Auto ABS issuance 2016 YTD has been in line with the generally softer primary ABS market this year, lagging behind projections and 2015 issuance.
AR: With the ways vehicle quality and amenities have improved, how differently are vehicle depreciation and values viewed, especially compared to the distant past when some units with 100,000 miles were considered nearly worthless?
TH: It helps to think about a sector where technology has advanced much faster than autos. Consider cell phones. Ten years ago, the iPhone was about to be launched; Nokia flip phones and BlackBerries were state of the art. In July 2006, a Nokia 6610 was worth, say, $30 to buy secondhand. It was a solid, working brick that made calls, sent texts and allowed owners to play Snake to their heart’s content. Today, a secondhand iPhone 4 or Samsung Galaxy is $30. The 2016 $30 phone is a much better unit than a 2006 $30 phone, but both are (or were) worth $30. The point is that prices of old equipment are determined relative to the best, state-of-the-art products that exist at the time. The quality of these products rise much faster than their prices.
What this means is that modern consumers of 100,000-mile cars have much better, safer, more enjoyable, more reliable rides than they used to, and are therefore more expensive to buy in the secondary market. We expect the quality of the 100,000-mile car to grow very strongly for the foreseeable future.
AR: What technology advancement do you project as possibly impacting auto financing most going forward?
TH: Most would say self-driving cars or Uber. These do hold the power to disrupt the auto sector, though they will take longer to transform the industry than many expect.
However, auto finance is long overdue for a “Moneyball revolution” like that which happened to professional baseball over the past decade. The auto finance sector will rely less and less on subjective assessment of quality to derive price projections. Test drivers will be replaced by statisticians in determining residual prices, in the same way that talent scouts have been usurped by data scientists. The most transformative technoogical advances will be in the form of advanced statistical methods applied to used-car price projections.
If dealers aren’t already looking through the rental-risk unit run sheet at the auctions where they typically buy inventory, perhaps they should be — considering what might be crossing the block nowadays.
“It’s interesting as we note the typical rental-risk unit comprises a much more diverse mix of models, makes and colors than there used to be in the past. That’s good,” Cox Automotive chief economist Tom Webb said. “There are a lot of different options for a dealer when looking at the off-rental units. They can probably buy something that their customer wants.
“The rental fleet is much more diverse. Certainly, it’s skewed to the car side, but a lot of small crossovers because the rental car companies are doing a good job of remarketing them. You’ve got those specialty high-line rental units now, which is also a good thing,” Webb continued.
“Even with the models, the rental car companies do a much better job of contenting the vehicle like a traditional retail unit as opposed to in the past where you could say ‘that’s a rental unit’ because it’s got crank windows or something. Those days are past. There used to be a time where all those were painted white, which was not good either for residual values. It’s a much nicer spectrum of vehicles,” he went on to say.
A year ago when Auto Remarketing compiled its annual report about the off-rental market, Manheim noticed mileage for these units at an all-time high. A streak of four consecutive quarters for mileage increases left the average well above 50,000 miles, more than double the figure Manheim spotted in early 2007.
“The average mileage now is more in tune with what we’ve seen since this recovery started,” said Webb, who put the average at the midpoint of this year at about 38,500 miles. “It’s more like the 2009 through 2014 time period.
“A lot of that was caused by Hertz, primarily the second quarter of 2015, where it hit record highs. They were going through a lot of management changes and they had issues with SEC filings so they just kept their units longer,” Webb added.
Over at KAR Auction Services, executive vice president and chief economist of ADESA Analytical Services Tom Kontos isn’t seeing as much of an average mileage drop-off. Kontos indicated the average mileage for rental-risk units going down the lanes at ADESA is still near 50,000.
“That’s the data I get from our auctions. Maybe more broadly, the trend isn’t quite so high. But at least the units we’re selling at ADESA, we’re seeing pretty high mileage,” Kontos said.
Still, Kontos agreed that off-rental vehicles are a hit with dealers, especially if they can obtain highly coveted program units during closed factory sales.
“The consistency of those (program) vehicles is what it’s always been,” Kontos said. “If they’re not already in good condition, the manufacturers do what they can to recondition them. Those units are always some of the better cars available to dealers at auction.
“The demand and attractiveness of off-rental vehicles is probably better than it already was because it was already pretty good,” Kontos continued. “The rental-risk units have been attractive to franchise dealers because they’re in the younger age category — a current or 1-year-old model.
“What I would add that’s different today is the popularity of certified pre-owned vehicles, where the off-rental unit does lend itself to very well,” he went on to say.
ABC St. Louis general manager Todd Ritter concurred with Kontos’ assertion about the connection of CPO and off-rental vehicles bringing out the hammer at his auction each week.
“I think dealers have always used rentals to fill spots on their lots. With the growth of CPO, we definitely have seen an increase in demand for these vehicles,” Ritter said.
Rising off-rental supply
Both Webb and Kontos pointed out supply of off-rental units in the wholesale market is on the rise simply because rental car company fleets are growing.
“Since the recession ended, new vehicles into the rental fleets have gone up,” Kontos said. “Now it’s not been disproportionate to the growth in new-vehicle sales in general, so it’s not as if manufacturers have been favoring rental sales to the degree they might have before the recession.
“The fact of the matter is there has been growth of new vehicles into the rental fleet, and therefore you would expect growth — and there has been — in off-rental volume over the last few years at auction,” he continued.
And like Webb mentioned, the diversity of rental-risk volume has expanded. No longer are the rental lanes full of domestic, four-door sedans painted white with not many features beyond an engine and transmission.
“The actual volumes are spread across a wider array of manufacturers than there used to be in the past where it was traditionally GM, Ford and Chrysler. Actually GM, Ford and Chrysler’s share of sales into rental is now less than it’s ever been,” Webb said.
“The sales into rental are actually front-loaded into the first part of the year so we’re up about 6.7 percent year-to-date through July,” he continued.
“The interesting thing this year that has gotten a lot of press is General Motors has pulled back very dramatically from new-vehicle sales into rental this year whereas some players have increased,” Webb went on to say.
And while GM might be delivering fewer units to rental companies, what the automaker is doing in the remarketing department is disciplined, too. ABC St. Louis runs hundreds of GM units down its lanes each week.
“Our major rental account (GM) has a standard risk turn-in policy, so they have stayed fairly consistent,” Ritter said.
Like dealers, executive vice president and chief economist of ADESA Analytical Services Tom Kontos is grappling with the challenge of stop-sales, too.
According to ADESA Analytical Services’ monthly analysis of wholesale used vehicle prices by vehicle model class, wholesale used vehicle prices in July averaged $10,362 — down 2.0 percent compared to June but up 4.9 percent relative to July of last year. Kontos explained the year-over-year rise was again due to the strength of truck prices, whereas car prices fell on an annual basis. Most segments experienced seasonal month-over-month declines.
“Average wholesale values fell again seasonally in July, but they remain up on a year-over-year basis largely because of the continued price strength of trucks and continued growth of younger, lower-mileage, higher-priced off-lease supply,” Kontos said in his latest Kontos Kommentary that accompanied the latest wholesale price analysis from KAR Auction Services.
“Recalls also played a role in the overall positive price performance, so it is not clear how wholesale prices might have fared absent the supply curtailments stop-sales caused,” Kontos continued. “Nevertheless, retail used vehicle sales — especially near-record CPO sales — remain strong, providing demand-side support for wholesale values.”
ADESA indicated average wholesale prices for used vehicles remarketed by manufacturers moved higher by 0.6 percent month-over-month and 10.2 percent year-over-year. Kontos noted automakers sold almost 20 percent fewer units this year than they did last July.
“Recalls are playing a major role in this reduction, as vehicles are ‘stop-saled,’ awaiting parts and/or OKs from manufacturers for sale,” he added.
ADESA also noted prices for fleet/lease consignors softened by 2.5 percent sequentially but rose 3.1 percent annually, as these consignors sell “more younger, lower-mileage off-lease units than they did last year,” according to Kontos.
Furthermore, Kontos pointed out dealer consignors registered a 1.1-percent decrease versus June, but a 5.3-percent increase relative to July of last year.
And as he referenced earlier, Kontos recapped that July certified pre-owned sales were up 4.8 percent month-over-month and up 5.6 percent year-over-year, according to figures from Autodata Corp. that Auto Remarketing also highlighted here.
Kontos provided a video commentary as well that can be seen at the top of this page or by going here.
ADESA Wholesale Used-Vehicle Price Trends
| |
Average |
Price |
($/Unit) |
Latest |
Month Versus |
| |
July 2016 |
June 2016 |
July 2015 |
Prior Month |
Prior Year |
| |
|
|
|
|
|
| Total All Vehicles |
$10,362 |
$10,571 |
$9,876 |
-2.0% |
4.9% |
| |
|
|
|
|
|
| Total Cars |
$8,326 |
$8,562 |
$8,511 |
-2.8% |
-2.2% |
| Compact Car |
$6,325 |
$6,465 |
$6,928 |
-2.2% |
-8.7% |
| Midsize Car |
$7,520 |
$7,658 |
$7,501 |
-1.8% |
0.3% |
| Full-size Car |
$6,984 |
$7,367 |
$7,852 |
-5.2% |
-11.1% |
| Luxury Car |
$12,844 |
$13,078 |
$12,575 |
-1.8% |
2.1% |
| Sporty Car |
$13,653 |
$14,274 |
$12,852 |
-4.3% |
6.2% |
| |
|
|
|
|
|
| Total Trucks |
$12,447 |
$12,595 |
$11,414 |
-1.2% |
9.1% |
| Minivan |
$7,728 |
$7,830 |
$6,793 |
-1.3% |
13.8% |
| Full-size Van |
$12,823 |
$12,500 |
$12,611 |
2.6% |
1.7% |
| Compact SUV/CUV |
$10,725 |
$10,882 |
$10,219 |
-1.4% |
5.0% |
| Midsize SUV/CUV |
$11,054 |
$11,118 |
$9,868 |
-0.6% |
12.0% |
| Full-size SUV/CUV |
$12,828 |
$13,657 |
$11,483 |
-5.9% |
11.9% |
| Luxury SUV/CUV |
$18,449 |
$18,842 |
$17,189 |
-2.1% |
7.3% |
| Compact Pickup |
$8,727 |
$8,718 |
$7,938 |
0.1% |
9.9% |
| Full-size Pickup |
$15,855 |
$15,836 |
$14,728 |
0.1% |
7.6% |
Source: ADESA Analytical Services. June revised.
Perhaps contrary to dealers who do not have unlimited floor-plan availability, Cox Automotive chief economist Tom Webb said “wholesale pricing is not exceptionally high” even as the Manheim Used Vehicle Value Index moved higher for the fourth consecutive month.
Wholesale used vehicle prices (on a mix-, mileage- and seasonally adjusted basis) increased in July by 2.3 percent, leaving the latest index reading at 127.0. It’s the highest point for the monthly reading in more than five years. The last time Manheim put its index mark at 127 or higher was June 2011, when it came in at 127.5.
“Although there was a near-universal expectation that wholesale prices would suffer in 2016 due to growing wholesale supplies, current auction values are not abnormal relative to several long-term historic relationships,” Webb said on Friday in his commentary that accompanied the latest Manheim index.
“Most notably, with respect to new-vehicle pricing (when looked at using both the new-vehicle consumer price index and average transaction prices), wholesale pricing is not exceptionally high,” he continued.
“Monthly payment differentials and other financing terms (such as the typical down payment) also support the current new/used price relationship,” Webb went on to say. “And, as is oft noted, narrowing margins mean that all of the increase in wholesale pricing is not being totally borne by the retail used-vehicle buyer.”
When taking a closer look at the six vehicle segments Manheim tracks to compile its monthly index report, Webb pointed out the weakness in compact car prices abated a bit in July. Prices for compact models decreased by only 1.4 percent in July, a fraction of what analysts spotted several times in the past few months when the drop would be several times that figure.
“Although compact cars remained the weakest of all the major segments over the past year, their pricing over the past three months outperformed the overall market,” said Webb, who again will be back as one of the experts at Used Car Week, which runs from Nov. 14-18 at the Red Rock Resort and Casino in Las Vegas.
“Modest price improvements and better inventory levels on the new-vehicle side helped,” he continued.
“Sports cars, pickups and mid- and full-size SUVs are the only segments with significant increases in wholesale pricing over the past year,” Webb added.
In July, prices for midsize cars edged lower by 0.2 percent. But prices in the other four segment climbed year-over-year, including luxury cars (up 1.6 percent), SUVs/CUVs (up 2.3 percent), vans (up 4.6 percent) and pickups (up 6.7 percent).
Also in the wholesale space, Manheim indicated that lower mileage and better mix drove rental-risk prices up in July.
“As was the case in June, a straight average of auction prices for rental risk units sold in July jumped substantially (up 21 percent) from a year ago because of significantly lower average mileage (down 21 percent) and a richer mix of units sold,” Webb said.
“After adjusting for mileage and broad shifts in the mix of market classes, rental risk prices were up less than 1 percent on both a month-over-month and year-over-year basis,” he added.
Recapping July retail sales
Elsewhere in his commentary, Webb mentioned information from the National Automobile Dealers Association that indicated total used retail unit volumes increased 5 percent in the first six months of the year with franchised dealers registering a 4-percent rise and independent stores generating a 7-percent lift.
“Preliminary numbers and channel checks indicate the gains continued in July,” Webb said.
“It is true that the streak of 27 consecutive quarters of same-store retail used unit sales gains by the seven public dealer groups came to an end in the second quarter of this year, but that was due to the high level of stop-sale units,” he continued.
“It is expected that the repair of those units will speed up as the third quarter progresses, and that will support further retail sales gains,” Webb added.
On the new-model side, Webb explained that five weekends and tactical incentives push July sales higher.
Webb noted new cars and light-duty trucks sold at a seasonally adjusted annual rate of 17.8 million in July. That was up “considerably” from June’s 16.6 million pace and the first half rate of 17.1 million, according to Webb.
“We still consider the new vehicle environment to be relatively benign with respect to used vehicle values,” Webb said.
“Sure, incentive spending jumped at a double-digit pace in July, but much of it was tactical, and some of it was temporary. And, more important, it worked,” he continued. “Both inventory levels and balance ended the month better than where they started.”
With a couple of pockets where dealer activity in the lanes seemed a little more upbeat, Black Book summarized that wholesale prices moved at a “humdrum pace” to close out July.
This week’s Black Book Market Insights report noted car segments depreciated at nearly double the percentage of trucks this past week. Also, midsize car segments and compact crossover/SUV segments saw the greatest depreciation during the week.
“The wholesale market values continue to depreciate at a humdrum pace as dealers report slow sales in retail,” said Anil Goyal, Black Book’s senior vice president of automotive valuation and analytics, who will make multiple appearances during Used Car Week at the Red Rock Resort and Casino in Las Vegas from Nov. 14 to 18.
Volume-weighted, Black Book editors determined overall car values decreased by 0.47 percent last week, similar to the average depreciation rate of 0.46 percent seen in the previous four weeks.
In car segments, the midsize car segment declined the most, dropping by 0.91 percent.
Volume-weighted, editors found that overall truck values decreased by 0.26 percent last week, slightly better than the average change of 0.35 percent seen in the previous four weeks.
In truck segments, Black Book said the compact crossover/SUV segment declined the most, softening by 0.48 percent.
When Black Book representatives reported back to headquarters from the lanes, two auction watchers relayed these reports:
—In Florida, it was a “good sale today at this location, dealer lanes were very busy."
—In California, “the market has slowed down a little in this area, but all lanes still seemed to do pretty well.”
While the lane recaps in those sunny locales conveyed an upbeat sentiment, a Black Book representative in Tennessee said, “Dealers reporting that sales have been very slow this week on their lots, leaving very little to send to auction. Plenty of no-sales here today.”
Up in New Jersey, the theme was “slow retail and wholesale in this market location.”
And finally in Washington, the sentiment from the Northwest was: “Prices are down on most everything here. Consignment was better than last week but still low compared to normal.”
Specialty markets update
As it does monthly, Black Book shared trends associated with the specialty markets. Editors’ thoughts are as follows:
—Collectible cars: Black Book indicated the automotive events held in the middle of August on California’s scenic Monterey Peninsula have become the year’s “most important gathering for high-end car collectors and enthusiasts.”
—Recreational vehicles: Editors described the wholesale market as “very consistent” last month, with motorized units and towables not only moving in the same direction, but changing in similar amounts.
—Powersports: Black Book noticed values in the powersports market moved down across the board this past month. “With the end of summer upon us, many dealers have begun to draw down their inventory of street bikes as we head into the fall,” editors added.
—Heavy duty: Black Book noted the volume of available used trucks continues to grow, “which ensures good buys at HD auctions for most.”
—Medium duty: In the medium duty truck wholesale market, editors said they “saw the older models decline more and the newer trucks decline less.”