About the time Memorial Day rolls around, it seems prices for subcompact cars take a major tumble. Black Book now has seen weekly depreciation for these gas sippers drop by close to 1 percent or more at this point on the calendar for three years in a row.
Last week — which was week No. 21 on Black Book’s wholesale market calendar — subcompacts posted the steepest weekly depreciation at 1.09 percent. A year ago at this juncture, the decline was 0.99 percent, and in 2014, the decrease was event sharper at 1.19 percent.
Elsewhere in the latest edition of Black Book Market Insights, car segments overall saw lighter depreciation than trucks. “Though marginal, the overall truck segment declined more than the car segment for the first time in eight weeks,” said Anil Goyal, Black Book’s senior vice president of automotive valuation and analytics.
As Goyal indicated, the difference was marginal as volume-weighted, overall car values decreased 0.23 percent last week. The same volume-weighted look at truck prices turned up a 0.27-percent softening.
Like subcompact cars, the subcompact crossover segment experienced some significant depreciation last week as prices softened by 0.88 percent. However, the subcompact luxury crossover segment was the lone truck segment to increase in value at 0.71 percent.
Also producing slight upticks in prices were full-size cars (up 0.03 percent) and sporty cars (up 0.16 percent).
Meanwhile in the lanes, dealers shared varied assessments of wholesale activity with Black Book’s representatives. An operator in Florida noticed what might have been the busiest scene, noting, “All lanes were very active today with buyers saying they need cars and are willing to pay for them.”
Up in Pennsylvania, a similar scene unfolded as a dealer mentioned, “Demand in this area seems to be good for both new and used.”
And in Michigan, a sweet spot for used car managers kept the hammer sounding as a dealer noticed, “4- and 5-year-old units are doing very well in this auction location.”
On the opposite side of the country, a dealer in Washington said, “The market was a little softer again this week with 4WD trucks and SUVs still in demand.”
Finally, a dealer in Nevada summed up the week by saying, “The trend here today seemed to be improved optimism about the market. Sales were good in almost all segments.”
When CarGurus launched its Deal Ratings Badges program that lets dealers display vehicle price endorsements from CarGurus on their own websites, the company shared an interesting statistic about third-party market-value verification and car-shopping.
Seventy-eight percent of 2,000 in-market car shoppers surveyed by CarGurus said they would not make a used-car purchase until they view independent, third-party data on that vehicle’s price.
Hence, the service CarGurus is providing. Through the program, dealers are able to automatically display CarGurus badges on qualifying vehicles indicating the car is “Good Deal” or a “Great Deal.”
But consumers are not just thinking about dollar figures, most likely. So, beyond price, what else do in-market shoppers want to verify through a third party?
We posed that question to Marty Blue, senior vice president of business development and dealer marketing at CarGurus.
“With our site in particular, the savvy consumer knows that we’re also factoring in reviews of dealers,” she said in a phone interview with Auto Remarketing.
“So, we factor that into our ‘Good Deal/Great Deal’ analysis … so that they can make sure that when they are going to get this Good Deal, they’re going to get it from a reputable dealer,” she said.
That begs the question: what are some of the qualities that strongly reviewed dealers have?
“The biggest one is communication,” Blue said. “And having a dealer get back to them quickly and being able to answer their question. And then transparency.
“I don’t mean just transparency on price on that,” she said. “If a dealer says the car is on the lot, the consumer wants to know this car is on the lot.”
Of course, transparency on price is key, as well.
And Blue pointed out that consumers are not always simply looking to find the lowest price point.
“We don’t ever recommend to dealers that they always try to have their inventory be the lowest price on our site” — unless, she clarified, the overall strategy is to be low-price, high-volume.
“Because of the pricing tool that we have in our dashboard, dealers can always figure out where they should price their inventory in order to be a Great Deal, a Good Deal, a Fair Deal; but also so that they can also see where in our rankings they’re going to show up … and we find that inventory that is Fair is just as likely to get a lot of leads as inventory that is Great or Good.”
CarGurus announced the badge program on May 19. In essence, it gives dealers a way to “provide their customers with independent validation that they are getting a good deal,” the company said in a news release.
The real view of the RVI Used Vehicle Price Index showed an increase in wholesale vehicle prices of 0.6 percent in April when compared to March. When compared to April of last year, the index fell by 5.5 percent.
When looking at the nominal view of the Used Vehicle Price Index, the reading ticked up by 0.5 percent in April as compared to March. However, prices fell by 3.9 percent from last year.
RVI Group noted when it released its most recent market update on Wednesday that most vehicle segments saw small upticks in residual values on a month-over-month basis in April.
Sporty coupes and full-size sedans saw the greatest month-over-month increase in April at 1.9 percent and 2.2 percent, respectively.
Meanwhile, luxury full-size sedans and compacts saw the greatest declines, both at 1.1 percent.
While the latest Black Book Market Insights report showed relatively mild depreciation last week among the majority of car and truck segments, a handful of dealers across the country feel prices will hold relatively steady until July.
As a dealer in Arizona shared with Black Book the sentiment about prices staying steady until about the summer’s midpoint, a dealer in California added that “the market trend at this location is good with demand still being placed on truck products.”
Demand for trucks was prevalent up North, too; as a dealer in Minnesota remarked, “Truck sales volume still exceeding cars at this location.”
Black Book’s latest report collected two perspectives from dealers in Tennessee. One operator said, “Auction was a little slow today with many no-sales,” as yet another added, “Prices in most lanes seemed to be normal to low. Clean compact cars are in demand but in short supply this week.”
Meanwhile, the ramifications of all the severe weather in Texas started to show up in the lanes as a dealer mentioned, “Dealers and consumers both are receiving insurance claims from all the bad weather and it shows through the increase in auction sales.”
Whether or not the units have been damaged by Mother Nature, Black Book reiterated that depreciation didn’t move dramatically last week. In fact, editors noticed that sporty cars, along with some vans, pickups and utilities, saw an increase in value.
“Most vehicle segments showed fairly stable values last week except for luxury cars and compact vans, which declined at a steeper pace,” said Anil Goyal, senior vice president of automotive valuation and analytics at Black Book.
Volume-weighted, Black Book determined that overall car values decreased by only 0.16 percent last week. In comparison, the reading was better than the average depreciation rate of 0.22 percent seen in the previous six weeks.
As Goyal mentioned, editors found that luxury car and prestige luxury car segments experienced the most drop in value at 0.72 percent and 0.51 percent, respectively.
Volume-weighted, Black Book indicated overall truck values changed very little last week. Editors added that trends in the last six weeks have been relatively flat as well.
The compact van segment showed the largest drop at 1.59 percent.
Black Book signs distribution agreement with Gauss Digital Marketing
In other company news, Black Book on Tuesday announced a distribution agreement with Gauss Digital Marketing to leverage Bullseye Prospecting as a resource to streamline efficiencies and elevate profit potential in dealer customer campaigns.
Powered by Black Book, Bullseye Prospecting is a comprehensive, all-inclusive platform designed to help marketing agencies automate customer campaigns for its dealership clients. Bullseye Prospecting uses data provided by Black Book to make the development of customer campaigns a simpler process.
Marketing agencies such as Gauss Digital no longer need to rely on multiple vendor partners in order to create a customer campaign by leveraging economies of scale for data coming from DMS, consumer, incentives, and vehicle equity and valuation sources. The program utilizes partnerships with photo and printer vendors for direct marketing collateral.
During initial tests, Bullseye Prospecting was found to deliver a 30 percent reduction in cost per car sold, driving better results with increased efficiency.
“Gauss Digital prides itself on serving clients as their external marketing department, and this includes a roster of auto dealerships that need quality campaigns to increase sales and customer engagement,” said Stan Gauss, chief executive officer of Gauss Digital. “We’re particularly excited about Bullseye Prospecting as it will increase efficiencies in the process of creating customer campaigns while also maximizing profit potential.”
Black Book senior vice president of sales Jared Kalfus added, “In order to lower customer campaign costs, dealers and their marketing partners need to re-evaluate the way in which they are developed and managed.
“Bullseye Prospecting helps offset tightening margins in auto sales, while also creating a one-stop-shop for campaign development in an effort to maximize results and ROI,” Kalfus went on to say.
To schedule a demo of Bullseye Prospecting, visit BullseyeProspecting.com.
When NADA Used Car Guide released its Guidelines report earlier this month, it predicted that May prices on used vehicles up to 8 years old would fall 2.8 percent to 3.3 percent relative to April, with prices for the majority of mainstream segments expected to fall by 3 percent or more.
It was a forecast similar to the 3-percent loss recorded for May 2015, but steeper than the 2.3-percent average decline in May of the previous two years.
So how have prices behaved so far this month? Auto Remarketing caught up with Larry Dixon, senior manager for market intelligence at NADA Used Car Guide, to find out.
“Prices of vehicles up to 8 years in age were down by 2.1 percent through the third week of May relative to all of April,” he said, noting that losses were steepest for compact cars (down 3 percent) and large and midsize cars (down 2.2 percent).
Midsize and large pickup prices, he said, were down by roughly 1.1 percent — the least of all segments; those prices had been predicted to fall by 2 percent to 2.5 percent.
As for June and July, overall prices were predicted to decline in the neighborhood of 2.5 percent to 3 percent relative to each preceding month.
Those predictions remain intact.
“Auction prices were more depressed over the first half of May than they were last week; as such, we have not made changes to our full-month forecast,” Dixon said. “July’s forecast remains unchanged as well.”
NADA Used Car Guide’s full-year forecast remains with prices expected to be down 5 percent to 6 percent on an index basis from 2015. This would place prices below 2011 levels and mark one of the steepest non-recession declines seen during the past 20 years.
A look back at April
NADA Used Car Guide’s seasonally adjusted used-vehicle price index fell for the fifth straight month in April, dropping 0.6 percent from March to 118. Lower prices in the first part of the year placed the index 4 percent below last year’s four-month average and dropped it to its lowest level in five years.
Lower prices in the first quarter of the year were mostly universal across segments, but April’s lackluster showing was due in large part to poor performance by cars.
— Prices for subcompact cars fell by 4.3 percent, nearly double the 2.3 percent loss averaged by the two closest segments, compact and midsize cars.
— Luxury car prices fell by 2.1 percent, pushing year-to-date losses for this segment to nearly 6 percent versus the fourth quarter. This, the highest in the industry, occurred despite a 29-percent pullback in late-model auction volume.
— Compact utility prices continued to fall compared to prior years. Depreciation for this segment reached an average of 1.2 percent in April, which was twice the amount of last year’s rate.
— Midsize pickup, midsize utility, luxury midsize utility and large pickup prices fell by a low average of 0.5 percent. Large utility prices were nearly unchanged.
— Subcompact car prices were 3.3 percent lower than in Q4 2015 YTD, while compact car prices were down 2.6 percent. Prices of other mainstream segments are down 2 percent or less.
— Across luxury segments, luxury midsize car prices were down 5 percent; losses for remaining segments (except luxury large cars) were mostly down by about 4 percent.
As for why subcompact car prices continue to fall, Dixon cited a general trend in consumer preference away from cars.
“Consumer demand for new and used trucks and utilities is simply much stronger than it is for cars, and consumers in the market for a small vehicle are more likely to purchase from the growing list of small utilities (Honda HRV, Chevy Trax, Mazda CX-3, etc.) than from a list of small cars,” he said.
Lower gas prices, higher fuel economy across all segments, and higher supply of subcompact cars combine to propel prices on these cars lower, he continued.
ADESA chief economist Tom Kontos dipped into his vast vocabulary to arrive at an adjective to describe what the company’s latest data indicated about the wholesale market. Kontos came up with a word that might be in your child’s next spelling bee — bifurcated.
According to ADESA Analytical Services’ monthly analysis of wholesale used vehicle prices by vehicle model class, wholesale used vehicle prices in April averaged $10,881 — up 0.8 percent compared to March and up 1.7 percent relative to April of last year.
Kontos said the wholesale market remains “bifurcated,” meaning split or forked, as he pointed out that car prices were lower on both a month-over-month and year-over-year basis while truck prices were higher.
“The traditional spring tax-season market appeared to wane in April, as average wholesale prices rose only modestly on both a sequential and annual basis,” he continued in his latest Kontos Kommentary. “As in previous months, drilling down into the data reveals softness due to supply growth that is not as evident in the top-line numbers.
“On a positive note, retail used vehicle sales rebounded from the March Easter holiday impact, continuing their healthy pattern of absorbing the growing supply without dramatic deterioration in prices,” Kontos added.
ADESA determined that average wholesale prices for used vehicles remarketed by manufacturers softened by 2.8 percent month-over-month and 5.4 percent year-over-year.
Analysts also noticed prices for fleet/lease consignors dipped 0.9 percent sequentially and 3.1 percent annually.
Kontos noted that only dealer consignors saw increases in average prices, registering a 2.7-percent increase versus March and a 2.2-percent uptick relative to April of last year.
Kontos closed by mentioning data from the National Automotive Dealers Association showed a 6.7-percent year-over-year increase in retail used vehicle sales by franchised dealers and a 3.4 percent increase for independent stores in April, and both were up significantly up month over month as sales rebounded from the Easter holiday impact in March.
He added that April certified pre-owned sales were down 4.6 percent month-over-month but were up 8.3 percent year-over-year, according to figures from Autodata Corp.
Kontos shared more assessment of the wholesale market in the video available at the top of this page.
ADESA Wholesale Used-Vehicle Price Trends
| |
Average |
Price |
($/Unit) |
Latest |
Month Versus |
| |
April 2016 |
March 2016 |
April 2015 |
Prior Month |
Prior Year |
| |
|
|
|
|
|
| Total All Vehicles |
$10,881 |
$10,793 |
$10,703 |
0.8% |
1.7% |
| |
|
|
|
|
|
| Total Cars |
$9,056 |
$9,078 |
$9,396 |
-0.2% |
-3.6% |
| Compact Car |
$7,009 |
$7,050 |
$7,271 |
-0.6% |
-3.6% |
| Midsize Car |
$8,137 |
$8,107 |
$8,219 |
0.4% |
-1.0% |
| Full-size Car |
$7,872 |
$7,803 |
$8,180 |
0.9% |
-3.8% |
| Luxury Car |
$13,862 |
$13,636 |
$14,214 |
1.7% |
-2.5% |
| Sporty Car |
$14,424 |
$14,517 |
$14,284 |
-0.6% |
1.0% |
| |
|
|
|
|
|
| Total Trucks |
$12,835 |
$12,657 |
$12,150 |
1.4% |
5.6% |
| Minivan |
$8,599 |
$7,939 |
$8,166 |
8.3% |
5.3% |
| Full-size Van |
$13,459 |
$12,769 |
$12,563 |
5.4% |
7.1% |
| Compact SUV/CUV |
$11,059 |
$11,065 |
$11,111 |
-0.1% |
-0.5% |
| Midsize SUV/CUV |
$11,625 |
$11,311 |
$10,712 |
2.8% |
8.5% |
| Full-size SUV/CUV |
$13,230 |
$13,372 |
$12,195 |
-1.1% |
8.5% |
| Luxury SUV/CUV |
$19,144 |
$18,857 |
$19,015 |
1.5% |
0.7% |
| Compact Pickup |
$8,678 |
$8,614 |
$8,107 |
0.7% |
7.0% |
| Full-size Pickup |
$15,919 |
$15,773 |
$14,595 |
0.9% |
9.1% |
Source: ADESA Analytical Services. March revised.
First-quarter retail used-car transaction prices have never been higher than they were in the opening three months of 2016, says Edmunds.com.
Edmunds' Q1 2016 Used Car Market Report released Thursday morning said the average retail transaction price on a used car was $18,838, a first-quarter record.
This is up 3.2 percent year-over-year, moving past 2015 figures that saw used prices eclipse $18,000 for the first time, Edmunds said.
The firm attributes the rise in used-car prices to near-new vehicles making up a greater percentage of franchised dealer used-car sales and stronger demand for utility vehicles, which tend to be more expensive than cars.
According to the report, near-new (which Edmunds defines as vehicles 3 years old or newer) comprised 52 percent of franchised dealers’ used-car sales in Q1. That’s up from 49 percent in the same period of 2015 and 47 percent in the same period of 2014.
Jessica Caldwell, director of industry analysis at Edmunds.com, said she wasn’t surprised to see the Q1 used retail transaction price record, even amid a surplus of supply coming back into the market that has many expecting used prices to decline (although many of those projections are tied to wholesale, whereas Edmunds analysis is strictly retail transaction prices).
“Especially if you have a higher concentration of newer vehicles, you’re looking at vehicles with much higher price tags when they were sold,” Caldwell said in a phone interview Wednesday. “Used is just a function of new-car price. I think from the standpoint that prices will go lower is strictly supply and demand. You’ve got a glut of supply — prices are probably going to go down.
“But you’re talking about cars that are a little more expensive, (there is) more content in them and a lot of them are newer. So because of that, you do see prices go up on an aggregate,” she said.
“If you look in the report, when we break it down by segment, you do see that there are some segments where it’s flat to negative. And then if you take it down by age of those vehicles, then it would start to look even (more) different,” Caldwell said. “I think it’s hard to tie a neat bow on used prices when you talk about it as an aggregate market, because there are so many nuances that the new market doesn’t see.
“But I don’t think it’s necessarily surprising — again, to look at not a wholesale (perspective), but from the retail side — that prices have climbed in Q1, because we’re talking about more expensive cars that are newer,” she said.
The average age of a used car retailed during Q1 was 4.5 years, down from 4.7, Edmunds said. And the vehicle age brackets to see the biggest increases in percentage of the used-car market were 1- and 3-year-old vehicles.
“With the average age of vehicles on the market ratcheting downward, it is no surprise to see a majority of vehicle categories experiencing a bump in values,” Edmunds said in the report.
“High consumer demand for utility and pickup segments, however, are keeping small car values at bay,” it adds. “On the other hand, we see large car prices trending upward with an increased share of Dodge Charger and Chrysler 300 sales helping to pull the segment’s values upward.”
The report’s graph that breaks down the Q1 price changes by vehicle segment shows truck and utility segments dominating the top of the list of increases.
Coming in at No. 1 was the compact truck, whose average used transaction price was up 11.8 percent year-over-year. It was followed by the midsize traditional SUV, whose prices were up 11.4 percent.
Large cars were third (up 9.3 percent), but two truck/SUV segments rounded out the top five: large traditional SUVs (up 8.5 percent) and large trucks (up 7.2 percent).
Premium luxury SUV prices climbed 7.1 percent.
Increases for the next 12 segments ranged from about 2 percent to 5.5 percent.
As Caldwell mentioned, there were two segments where prices fell (compact cars, down 1.5 percent; subcompact cars, down 5.7 percent) and three where prices were relatively flat (large crossover SUV, up 0.6 percent; midsize cars, up 0.4 percent; premium luxury cars, up 0.1 percent).
Softening car prices continued to be the talk among Black Book’s editors; so much that they dedicated much of this week’s Black Book Market Insights report to take a comparative look at how car segments have performed year-to-date in 2016 versus the same period last year.
According to Black Book data and analysis, all car segments have shown weaker retention overall year-to-date compared with last year. In particular, editors noticed sporty cars, premium sporty cars and full-size cars have shown some of the largest one-year changes in retention strength.
Turning back to just the most recent volume-weighted information, Black Book indicated overall car values decreased by only 0.28 percent last week. This is worse than the average depreciation rate of 0.17 percent seen in the previous eight weeks.
Editors mentioned midsize cars, compact cars and luxury cars showed the most drop in value of 0.47 percent, 0.39 percent and 0.36 percent, respectively.
Looking at the volume-weighted truck data, Black Book indicated overall truck values changed very little last week. The average depreciation rate in truck segments was 0.18 percent in the previous eight weeks.
Editors added sub-compact crossovers and sub-compact Luxury Crossover segments showed the largest increases at 0.55 percent and 0.57 percent, respectively.
“Sub-compact crossovers increased the most in value last week while the car segments continue to remain weaker than trucks,” said Anil Goyal, Black Book’s senior vice president of automotive valuation and analytics.
Moving along to what dealers told Black Book representatives in the lanes last week, operators in Texas and Arizona shared similar sentiments. The Lone Star State dealer said, “Prices were strong today with no bargains anywhere,” while the operator from Arizona noted, “Prices still holding fairly stable in this market area.”
In two other locations, units crossed the blocks but didn’t necessarily head to store inventory after the hammer fell. A dealer from Tennessee noted, “Good selection of clean cars today just not a lot of buyers,” while another operator in Florida noticed, “More no-sales here than in previous weeks.”
Up North, a Minnesota dealer added, “Truck volume is still exceeding car volume in this particular market.”
Finally, Black Book’s latest lane chatter rundown closed with two views from the Northwest as one dealer said, “Below average consignment this week but prices still seemed to be stable,” as another added, “Strong market here today with trucks in high demand.”
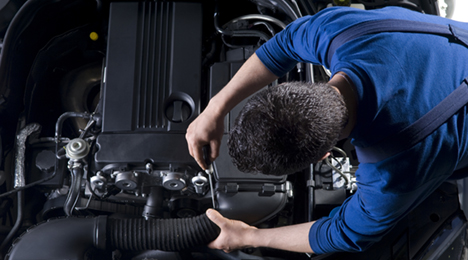
Your customer has either paid or is still paying for his or her vehicle, but now has to think about the cost of repairing it.
With pothole season upon us — and the threat of damage to a number of a car’s systems should you happen to meet up with one — the RepairPal Institute has compiled lists of the most and least expensive car models to repair.
The results, in a nutshell, show that the Lincoln MKZ tops the “most expensive” list with an average repair cost of $2,649, while the Nissan Sentra tops the “least expensive” list with an average repair cost of $931.
The RepairPal Institute Auto Service Cost Index draws upon RepairPal’s proprietary list of auto repair pricing across the United States. Researchers analyzed the cost of four common repairs (water pump, alternator, brake pad replacement and oil change) in 40 models across four categories: compact, midsize, luxury and SUV.
Some of the researchers’ key findings:
- Two compact cars – the Volkswagen Jetta (average repair $2,114) and the Mitsubishi Lancer ($1,931) – were among the Top 8 most expensive cars to repair. Researchers found this surprising, given these cars’ relatively low sticker prices and air of affordability. At around $2,000 per average repair each, these two models came in higher than many luxury models and all SUVs.
- SUVs ranked highly among the most affordable models. The Mazda CX-7 (No. 3) and the Ford Explorer (No. 5) has repair costs roughly 30 percent below average. Other SUVs populated both lists, with the Chevrolet Equinox bearing the highest average repair cost at $1,604.
- Of the top 3 most expensive models to repair, the highest — the Lincoln MKZ at $2,649 — actually has the lowest sticker price.
20 most expensive car models to repair:
1. Lincoln MKZ (luxury): $2649
2. Audi A4 (luxury): $2259
3. Lexus IS250 (luxury): $2234
4. Volkswagen Jetta (compact: $2,114
5. Volkswagen Passat (midsize): $2,087
6. BMW 328i (luxury: $1,965
7. Mercedes Benz C300 (luxury: $1,960
8. Mitsubishi Lancer (compact): $1,931
9. Infiniti G37 (luxury): $1,725
10. Chevrolet Malibu (midsize): $1,633
11. Chevrolet Equinox (SUV): $1,604
12. GMC Acadia (SUV): $1,603
13. Volvo S80 (luxury): $1,600)
14. Chrysler 300 (luxury: $1,578
15. Acura TL (luxury): $1,537
16. Nissan Murano (SUV), $1,503
17. Honda Pilot (SUV): $1,480
18. Toyota Forerunner (SUV): $1,480
19. Kia Sportage (SUV), $1,469
20. Kia Optima (midsize), $1,454.
20 most affordable car models to repair:
1. Nissan Sentra (compact): $931
2. Nissan Altima (midsize): $986
3. Mazda CX-7 (SUV): $988
4. Mazda6 (midsize): $1,026
5. Ford Explorer (SUV): $1,052
6. Honda Accord (midsize): $1,060
7. Ford Focus (compact: $1,064
8. Mazda3 (compact): $1,068
9. Hyundai Elantra (compact: $1,088
10. Ford Fusion (midsize): $1,093
11. Honda Civic (compact): $1,120
12. Hyundai Santa Fe (SUV): $1,179
13. Hyundai Sonata (midsize): $1,188
14. Kia Forte (compact): $1,190
15. Subaru Impreza (compact): $1,191
16. Subaru Legacy (midsize) ($1213)
17. Toyota Camry (compact): $1,244
18. Toyota Corolla (midsize): $1,323
19. Jeep Cherokee (SUV): $1,406
20. Cadillac CTS (luxury): $1,429
When a car shopper had a hybrid or electric vehicle trade-in last year, it would be put toward buying another hybrid or EV 38.5 percent of the time, says Edmunds.com.
This year, just 27.5 percent are going toward another hybrid/EV.
But perhaps what’s more head-scratching is this: Hybrid/EV trade-ins are more likely to go toward buying an SUV (33.8 percent) than any other segment.
“The overwhelming popularity of SUVs trumps just about any other trend in today’s market,” Edmunds director of industry analysis Jessica Caldwell said in an analysis last month. “SUV sales are up 22 percent in the last five years, and almost every other segment has suffered as a result.
“It’s especially true for hybrids and EVs, which generally don’t offer the size that today’s shoppers crave,” she said.
In fact, EV and hybrid loyalty has never been lower, according to Edmunds.
However, this should be viewed through an economics lens, rather than one of vehicle quality.
“This trend is not an indictment of the quality of these cars — hybrid and electric vehicles tend to be equipped with some of the most sought-after technology on the market today,” Caldwell said. “This is an economics trend, since today’s low cost of gas no longer makes it worth paying the price premium of hybrids and EVs.
“And there are so many fuel-efficient vehicles on the market today that environmental concerns weigh less than they might have in years past,” she added. “When you’re buying a vehicle that can get over 30 mpg, you can still say you’re doing your part to help the environment.”
It’s also important to note that the alt-fuel owners moving over to SUVs tend to still go the most eco-friendly route, most commonly choosing fuel-friendly compact SUVs, Edmunds said.
How much value they’re holding
When the shopper trades is in a vehicle, he or she is almost certainly considering what their current car is worth, as that can be pivotal to what is bought next.
So, perhaps another piece of the economics proposition is this: How well are these alternative-fuel cars retaining their values?
NADA Used Car Guide examined that in its latest Perspective report.
Your traditional gas-powered used vehicle depreciated 15 percent to 16 percent last year, NADA Used Car Guide said, with hybrids dipping an average of 17 percent to 18 percent.
Meanwhile, used plug-in hybrids depreciated 25 percent on average and the majority of electrics fell by more than 30 percent.
Greater depreciation, of course, leads to weaker retention. Consider NADA Used Car Guide’s data summarizing three-year vehicle value retention by segment on 2013 model-year vehicles.
In the compact car segment, for instance, gas-powered models held on to 49.5 percent of their value after three years. The six compact hybrids listed had retention ranging from 39.1 percent (Ford C-Max) to 53.9 percent (Toyota Prius).
Meanwhile, the electric Ford Focus was at 21.7 percent and the electric Nissan Leaf was at 26.9 percent.
The electric/hybrids listed for that segment fared better than the Focus and Leaf, but were still below the hybrids and gas-powered cars listed.
Similarly, in the subcompact category, gas-powered vehicles averaged 44.1 percent retention. The hybrid Honda CR-Z was at 47.9 percent, while the Fiat 500 (26.7 percent) and Smart FORTWO (22.2 percent) electrics came in well below.
In the midsize car category, the electric/hybrid Ford Fusion had three-year retention of 35.1 percent, compared to 47.4 percent retention average for gas models in this segment.
The hybrid midsize cars had retention levels ranging from 37.9 percent to 51.9 percent.
Of the five segments in NADA Used Car Guide’s data set that included either electrics or electric/hybrids (or both), there was one where the electric showed stronger retention than other vehicles listed: the luxury large car category, where the Tesla Model S reigns supreme — and by a large margin.
Its three-year retention was 56.2 percent, compared to 45.4 percent for the average gas-powered luxury large car. For comparison, hybrids included in the dataset included the Lexus LS (51.4 percent), Porsche Panamera (46.5 percent), Mercedes-Benz S Class (42.0 percent) and the BMW 7 Series (40.5 percent).
Still small slice
One key to bear in mind: Alternative-powertrain vehicles are still a considerably small slice of the overall new-vehicle market.
Jonathan Banks, NADA Used Car Guide's executive analyst, said in a news release on the report: “Looking at the past three calendar years, a whopping 47.7 million gasoline and diesel-powered vehicles were sold in the U.S. representing 96.6 percent of total sales over that period.”
Larry Dixon, NADA Used Car Guide’s senior manager of market intelligence, added: “By comparison, market share for alternative powertrains decreased from 3.8 percent in 2013, to just 2.8 percent in 2015 … with sales last year falling below 500,000 units despite the industry achieving nearly 17.4 million new-vehicle sales.”