In the latest installment of the annual Power 300 issue of Auto Remarketing, we launched a new feature to spotlight just a few of the companies on the list. In a Q&A format, we go behind the scenes with some of the leading companies in the used-car space.
Next up in this series is Larry Dixon, senior manager of market intelligence, NADA Used Car Guide
Auto Remarketing: Looking out over the summer months, what is NADA UCG’s prediction for depreciation? Will rates differ from seasonal norms at all, and what kind of pricing can dealers expect in the lanes?
Larry Dixon: We expect the pattern of depreciation to follow a typical path for the remainder of the year – usually we’ll see depreciation improve a bit June and July, increase between September and October, and then lessen again over the last two months of the year.
Last year was something of an anomaly in that depreciation through the heart of the summer was unusually steep, with prices of vehicles up to 8 years old falling by roughly 3 percent on a monthly basis in July and August. For context, depreciation for the pair has been closer to 2 percent over the past 10 years (excluding 2008–2009).
For 2015, we anticipate depreciation will move back toward the historical average. As for September and October, we expect prices to fall by about 3 percent per month — which is in line with what we observed last year. Depreciation in November and December is forecast to be in the 1 percent to 2 percent range — or a bit steeper than in 2014.
All told, we expect depreciation to reach 14 percent for the full calendar year, which is slightly worse than 2014’s rate of 13 percent. That being said, 14 percent is strong by historical standards. We foresee much steeper declines in 2016 and 2017.
AR: Let’s take a look at the used supply environment. Does NADA UCG expect any significant increase in supply over the course of the second half of the year?
LD: The rate of supply growth should be fairly steady moving forward through the second half of the year. NADA Used Car Guide’s used-vehicle supply forecast shows overall late-model supply (vehicles up to 5 years old) rising by 4 percent in the second half of the year and off-lease volume increasing by a more significant 9 percent. These figures are similar to our estimates for the first half of the year. Rising new-vehicle sales and lease penetration will keep volume on the rise for years to come.
AR: Are any segments, in particular, seeing supply expand more rapidly? If so, why?
LD: Supply growth has been greatest for subcompact cars and compact and midsize utilities (both non-luxury and luxury). Growth is a reflection of both new-sales growth and a rise in lease penetration. For example, not only have new compact utility sales grown by an incredible 72 percent since 2010 (new sales overall are up by roughly 41 percent), but lease penetration has moved from 16 percent to 25 percent as well. Combined, these factors increase used supply at a faster rate.
AR: What segments are performing the strongest as far as price retention goes, and why?
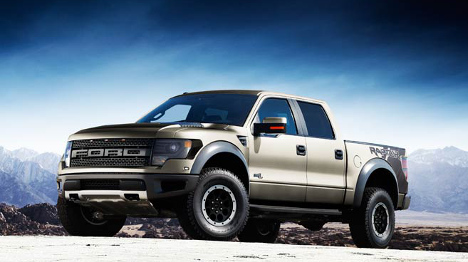
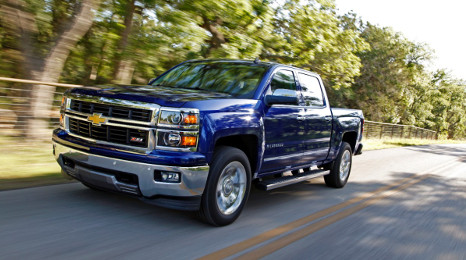
LD: Midsize and large pickups are doing exceptionally well right now. In fact, they’ve been the strongest performing segments for quite some time. Retention for 3-year-old midsize and large pickups stands at 64 percent and 60 percent, respectively. For context, average retention for all 3-year-old models is 52 percent. Retention for the two pickup segments has declined by just 2 percentage points since the end of 2014.
High new-vehicle prices, relatively low supply — pickup owners tend to hold onto their vehicles longer, therefore it takes more time for them to return to the market — and lower gasoline prices all support pickup demand and as such retention.
Other strong performing segments include compact, midsize and large utilities. Three-year retention for the group averages 56 percent. Highly versatile and more fuel-efficient than in the past, used demand for utilities mirrors the strength we’ve witnessed on the new side of the market.
Other features in this special section:
4 questions with NextGear’s Brian Geitner
Cox Automotive chief economist Tom Webb didn’t divulge any confidential Manheim Consulting team data about a consignor’s specific portfolio, but he still managed to illustrate how the firm’s information answered questions about perceived regional differences in wholesale pricing.
To close the July edition of Manheim’s Auto Industry Brief, Webb recapped a presentation segment he made to a large industry group. Webb reinforced the point that the company’s data on the price differences between auctions for the same vehicle is after sellers and buyers have moved vehicles and/or bought remotely to maximize profits.
“The differences that remain reflect what is left after all of the market arbitrage by sophisticated sellers and buyers,” Webb said.
To illustrate the situation, Webb shared an example by taking one of the highest-volume make/model/body vehicles Manheim sells and cross-referencing it with their average auction price at the company’s 10 highest-volume auctions for that vehicle.
The two highest-model-year versions of that vehicle sold were a 2012 and 2014.
For the 2014 vehicle, the high-to-low price differential was $449 or 3.2 percent. But for the 2012 model, the high-to-low price differential came in at $918 or 7.1 percent.
“The 2014 model-year version has a much smaller price swing (both dollar and percent) than does the 2012 model-year. Why? Because many of the sellers of the 2014 model-year were large commercial consignors that had already used their resources and economies of scale to move vehicles prior to sale,” Webb said.
“Sellers of the 2012 model-year version were more likely to be small commercial consigners or dealers,” he added.
3 reasons why new-vehicle sales might be stronger than first thought
Webb turned to Manheim Consulting’s blog on Friday to share some analysis connecting new-vehicle sales to the U.S. gross domestic product reading. Webb’s interest stemmed from revised GDP figures, which he said pointed to a “weaker recovery since the Great Recession and, as a result, emphasized further just how much autos have outperformed in recent years.”
To prove his assessment, Webb rewound back to when Ford still was in the first-generation production cycle for the Mustang.
In 1966, Webb recapped that new-vehicle sales declined 2.1 percent even though real GDP grew by a “very strong” 6.6 percent. He explained that occurrence happened because new-vehicle sales had already increased “dramatically” in each of the prior four years. In fact, new-vehicle sales first exceeded the 10-million mark in 1965.
On the opposite side of the spectrum, Webb noted that in 1982 new-vehicle sales declined by only 1.9 percent even though real GDP dropped by 1.9 percent. He said the resulting “disconnect” stemmed from the fact that new-vehicle sale had already fallen significantly in 1979, 1980, and 1981, producing a peak-to-trough swing of 31 percent
Webb said the industry should consider “how strange the new normal” has been by looking at these three facts:
— Only three times in the past 60 years has a double-digit increase in new-vehicle sales occurred when real GDP was growing less than 3.3 percent. Those three years came consecutively: 2010, 2011, and 2012.
— Only once have new vehicles increased in a year in which GDP grew less than 1.5 percent. That happened in 2013.
— 2014 was closer to the trend line (5.9 percent new-vehicle sales growth and 2.4 percent GDP growth), but still it represented the fifth consecutive year above the regression line.
While car values depreciated at twice the rate of truck values last week, this may seem like old news — but one new trend is now showing up on analysts' radar.
It’s not just the smaller cars feeling heavier depreciation as market correction from tax season highs, mid-size and larger cars are feeling downward pressure, as well.
According to the latest edition of Black Book Market Insights, overall prices for cars at auction dropped by 0.62 percent or $73 last week, which was higher than the average declines seen over the previous four weeks.
Trucks, on the other hand, saw values fall by just 0.27 percent or $44 last week, which is in line with movement seen over the past month.
“Depreciation rate on car segments picked up a little. While trucks continued to perform better, a couple of previously strong segments experienced a market correction,” said Anil Goyal, vice president of automotive valuation and analytics.
And for the car market, it seems lack of demand in the slower summer months might be contributing to lower prices and less movement in the lanes.
Black Book editors hear a buyer from Tennessee say, “Plenty of cars here today just not many buyers. Dealers say sales are soft on their lots at the present.”
Among the car segments, interestingly, segments across the board, not just the smaller units, experienced bigger drops in price last week than normal.
For example, the full-size cars saw prices drop by 0.91 percent or $90, the biggest decline out of all segments last week.
The upper mid-size cars also saw a large decline, with rates dropping by 0.77 percent or $86. The compact cars also saw larger-than-average drops, with rates falling by 0.87 percent or $72.
The story was a bit different for the better-performing sporty cars (-0.43 percent or -$69) and luxury cars (-0.21 percent or -$43).
Moving over to the truck side of the market, once again the full-size pickups experienced price strength last week, with prices dropping by a mere 0.09 percent or $17.
That said, two segments — compact pickups and full-size cargo vans experienced a market correction after several weeks of strong value retention, Black Book editors shared.
Compact pickup prices dropped by 1.01 percent or $151 last week, while the full-size cargo van segment experienced a decline of 1.01 percent or $71.
The best performing truck segment this past week was the minivan cargo units, which saw prices drop by just 0.01 percent or $1.
This slightly softer truck market was being noticed in the lanes, as well, as Black Book editors overheard a buyer from Michigan noting, “Trucks were actually a little soft here this week, probably due to low dealer attendance.”
Last week in the lanes brought with it price declines for all of the car segments, while once again pickup trucks held their value — a trend that has been witnessed for most of 2015.
“Car segment values continue to decline at a steady pace while most pickup and SUV truck segments enjoy strong retention,” said Anil Goyal, vice president of automotive valuation and analytics.
And in the latest Black Book Market Insights report, analysts spotted another trend, as well, impacting auction volume in the lanes.
Black Book editors said they are beginning to notice a “healthy amount” of 2015 model-year vehicles at auction, which they noted is in line with seasonality as dealers look to prepare their lots for 2016 models.
And many dealers are trying to clear their lots before rates at auction drop any further.
Last week, Black Book editors overheard a buyer from Tennesee say, “Several dealers said that they were dumping old stock before prices fell any further. Even at that, there were still several no-sales today.”
This past week car values dropped by 0.41 percent or $48, which is in line with average depreciation rates seen over the past three months.
Trucks, on the other hand, only dropped by an average of 0.31 percent or $60.
Among the car segments, the upper mid-size cars led the pack for depreciation, with rates dropping by 0.62 percent or $70. This segment was followed by the entry mid-size cars (-0.54 percent or -$50) and the luxury level cars (-0.55 percent or -$111), respectively.
A better performance was seen among the full-size cars, which held their value the best among the car segments with a 0.11 percent or $10 decline.
The prestige luxury cars also saw better price retention as rates only dropped by 0.14 percent or $42.
The truck segments once again outperformed their smaller counterparts, with the pickups posting the best numbers last week.
Compact pickups posted the best price retention with an increase in average price of 0.16 percent or $25. The mid-size pickups also posted an increase, with rates rising by a slight 0.04 percent or $4. These were the only two segments to see prices rise at auction last week.
July’s auction environment, as far as price movement discrepancy between cars and pickups, echo the same trends seen in June.
According to the latest RVI Market Update, as the RVI Used Vehicle Price Index dropped by 0.5 percent in June, compact vehicles and sedans saw the greatest price drops last month, while used prices for larger vehicles such as full-size pickups increased.
This statistic reflects the current trends well: According to RVI data, full-size pickup prices increased by 1.2 percent last month, and small pickup prices ramped up by 1 percent.
On the other end of the spectrum, sub-compact prices dropped the most in June, with prices dropping by 2.9 percent. The full-size sedans also took a hit with rates dropping by 1.9 percent, followed by the mid-size sedans decline of 1.8 percent.
Now is the time you might want to turn environmentally conscious shoppers on your lot looking for a deal toward the pre-owned electric vehicles in stock.
Why? Take a look at the residuals.
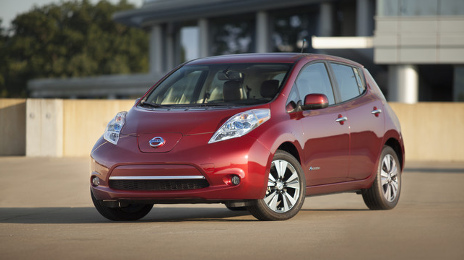
According to Manheim, the used 2013 Nissan Leaf will be worth only $7,650 by next July, while today’s price for the same unit sits at an average retail value of $14,900.
This statistic was highlighted in a recent blog post from Yahoo Autos, and author Steven Lang points out EVs are experiencing a “colossal loss of market value.”
And the Nissan Leaf isn’t alone.
In a recent report posted to its website, Cars.com found that the Smart ForTwo had the largest retail price decline (5.2 percent) from May 1 to May 31. And the Nissan LEAF wasn’t far behind at 5.1 percent.
And in a recent Blue Book Market Report, KBB analyzed the changes in Kelley Blue Book Auction Values of 2012- to 2014-model-year vehicles.The segment with the largest decline between May 1 and May 29 was the electric vehicle class, down 3.6 percent. In April, their values fell 8.5 percent.
And according to the Yahoo Autos blog report, these declines are expected to stop anytime soon.
When EVs first hit the market, federal tax credits and significant manufacturer incentives made these models an enticing buy for many fuel-conscious auto shoppers. But as Lang pointed out, “there are no similar incentives for buying used EVs,” and demand hasn’t lived up to hype, putting extreme downward pressure on used prices for some of these models. And with oil prices still far below average, fuel economy isn’t currently much of an incentive either.
And the luxury models aren’t immune to the surprising depreciation. According to the blog post, the 2013 Tesla Model S Performance is currently going for $74,000 and is forecasted to lose 28.9 percent of its value by July 2016, ending with a pricetag of $52,600.
And lesser known models such at the 2012 Misubishi i-MiEV are being hit even harder. According to Yahoo Autos, this model currently sells for an average of $7,950; by July 16 this number is forecasted to drop by 44.7 percent to $4,400.
One interesting point to note is residuals for hybrid vehicles and other alternative fuel options are not suffering in quite the same manner.
“Hybrid plug-in electric vehicles – those that offer gasoline and electric engines – are not expected to experience near the level of depreciation of their all-electric competition,” Lang wrote.
That said, EV prices are low, and are expected to get lower — proving a good buy for those customers looking for a long-term vehicle with no plans to trade-in — considering, if residuals continue down the same trajectory, many of these EVs might be looking at a 50-percent or more decline in value over the next couple of years.
Not surprisingly, used-vehicle depreciation slowed a bit last month, after May’s market correction stemming from tax season highs. And with relatively stable depreciation predicted for the rest of 2015, NADA Used Car Guide explained that strong prices for trucks are making up for weaker rates in among the car segments.
According to the latest Guidelines report from NADA Used Car Guide, prices of pre-owned vehicles up to eight years in age dropped by 2.5 percent in June, compared to the 3.2-percent decline see during the same month last year.
This month, NADA UCG expects prices will drop between 2 percent and 2.5 percent from June rates, with another 2.5-percent decline in August. According to the commentary from NADA's Jonathan Banks, the organization predicts depreciation will continue to ramp up through October, “as the market heads into what is typically the softest part of the year.”
“With the first half of the year now behind us, one could say used vehicle prices have held up well despite mounting pressure from the new vehicle market and rise in supply,” Banks said in the the report.
Taking a look at some specific numbers through the first six months of the year, overall depreciation year-to-date came in at 9 percent, which is up from the 7.2-percent rate recorded last year. That said, is it down from the 10-percent depreciation rate recorded during the first half of 2013.
NADA UCG expects depreciation of 14 percent for the full year, which would just be slightly worse than 2014’s rate of 13 percent, even as used supply continues to expand.
The stable performance this year, NADA explained, is driven by strong truck prices making up for dipping car prices.
Cars have been taking a hit, specifically the subcompact, compact and midsize cars. According to NADA UCG data, compact and midsize car prices dropped by almost 3 percent in June. They have fallen 11 percent year-over-year during the first half of 2015.
And subcompact cars are seeing even more downward pressure with a decline of 4 percent in both May and June, and year-to-date depreciation of 12 percent. NADA UCG pointed out this year-to-date figure is 4 percent worse than 2014’s mid-year numbers for the subcompact segment.
“Starting with cars, subcompact, compact and midsize car prices have been among the softest all year. This is due in large part to intense new market competition, both within their respective segments and from high demand crossover utilities (lower gasoline prices aren’t helping either),” Banks explained in the report.
According to NADA UCG, new subcompact, compact and midsize car incentives were up by a combined 10 percent through May.
On the other hand, while car prices suffer, rates for used trucks and utility vehicles have held up overall industry values through the first half of the year.
For example, in June large pickups only saw prices drop by 0.5 percent in June with year-to-date depreciation of just 4 percent, which is the best performance out of all the segments NADA UCG tracks.
In fact, the report pointed out large pickup rates haven’t fallen by more than 2.5 percent on a monthly basis in more than five years, showing the segments staying strength among American consumers.
“On a like-age basis, we continue to see trucks and SUVs outperforming their car counterparts,” Banks said.
Take this statistic: through the first half of the year, large pickup prices were up by 7.3 percent from the same period of 2014.
A few other segments contributing to a more stable overall used prices are the mid-size utility and large SUV segments, whose prices were up 4.1 percent and 3.1 percent, respectively, through the first half of the year.
Though during the first week of the month, the tides turned as trucks experienced larger auction price declines than cars, business was back to a “summer normal” last week.
According to the latest Black Book Market Insights report, trucks remained ahead of the game in the lanes last week as most car values declined.
“After an aberration last week (first week in July), car values continued their decline at a higher pace as compared to trucks. Entry-level cars dropped the most, while compact SUVs retained their value,” said Anil Goyal, vice president of automotive valuation and analytics.
Last week, prices for cars dropped by 0.58 percent or $69, which was higher than the average drop in the last 8 weeks.
Trucks, on the other hand, only saw a drop of 0.19 percent or $38, which was similar to the price movement seen over the past two months.
Some of the most significant price movement seen among the car segments was seen by the entry-level cars (-1.03 percent or -$70), compact cars (-0.75 percent or -$63), full-size cars (-0.76 percent or -$76) and near-luxury cars (-0.72 percent or -$122), which all saw prices drop by over 0.70 percent last week.
The strongest price retention for cars last week was seen among the luxury level cars, which saw prices drop by 0.27 percent or $56.
Increasing supply is allowing dealers and buyers to be choosier about which vehicles they put on their lots; another factor putting downward pressure on car prices.
For example, Black Book editors overheard a buyer from North Carolina say, “Things have slowed down, and buyers are getting pickier,” another sign of an average summer market.
Among the truck segments, Black Book editors pointed out one trend, in particular, that has been on their radar.
Over the past year, full-size vans have experienced better-than-average retention due to short supply. Now, as the number of full-size vans in the market continues to increase, the trend is putting downward pressure on prices.
Last week, both the full-size cargo vans and passenger vans experienced a price drop of 0.73 percent, which translates to declines of $105 and $106, respectively.
“We expect to see increased drops in this segment as supply improves later in the year,” Black Book editors reported.
The only truck segment to see prices rise last week were the full-size pickups, which bumped up by 0.06 percent or $11.
Cox Automotive chief economist Tom Webb is confident the used-vehicle industry will eventually surpass the all-time sales record sometime in the coming years; a feat that would require eclipsing the mark of 44.14 million units CNW Research indicated was established 10 years ago.
But a return of double-digit margins for dealers on those used-vehicle turns? Webb isn’t sure the rare heyday of margins above 11.5 percent seen back in 2009 will ever be enjoyed again.
Webb attributed part of the reason why used sales should top the all-time record is growing volumes of off-lease vehicles, which is already fueling the certified pre-owned market to sterling figures.
The latest data from the National Automobile Dealers Association shows 4.4 million used vehicles turned in June, pushing the total at the halfway point of 2015 to close to 18.6 million used sales.
While the pace would have to intensify during the second of this year to approach the record set in 2005, Webb indicated during his recent quarterly conference call that the majority of factors influencing used sales such as financing and inventory availability “are becoming better.”
The growing sales volume is helping dealerships enjoy record profits for the used operations. That’s despite margins rebounding only slightly this past quarter after bottoming out during the second half of 2014, according to Webb’s tracking of the seven publicly traded dealer groups that he says provides a barometer for how the entire industry is performing.
Going back eight years, Webb pegged the margin high at above 11.5 percent during the worst of the recession in late 2008 and early 2009. Since that time, margins for these dealer groups have drifted lower, settling at just about 9.5 percent this past quarter.
Webb cautioned that the margin peak “was very much an anomaly related to the recession and the supply of units, the volume of units being sold and holding out for gross.”
He continued with, “Rather being overly concerned about the margin compression, I would point out that when a competitive industry like auto retailing achieves greater efficiencies, and they certainly have, some of those savings are passed on to the consumer in the form of lower margins.
“But as the growth in throughput stalls and those further efficiencies seem harder and harder to achieve, it is important that we in the industry continue to look at where the pain points are and develop solutions to relieve them,” Webb added.
Webb also mentioned that while his dealer group margin data only goes back eight years, he insisted that if he had information “going back decades and decades,” the margin metric would show a long-term downward trend.
“It’s something we just have in the industry. Margins go down; they don’t really come back up,” Webb said.
“But again, that’s doable because you have great efficiencies, greater throughput overall,” he continued. “You’re still getting great F&I income. At these margins, you’re still making record profits. I would say we start might start to bottom out in terms of overall margins and they only go down further to the extent that the industry achieves even great efficiencies.”

Though prices in the lanes still remained higher than the first days of summer last year, used-vehicle rates still experienced a significant downturn in June.
According to the June edition of Kontos Kommentary, wholesale prices were down 2.5 percent from May, but up 2.4 percent year-over-year.
ADESA chief economist Tom Kontos reported the average price for a vehicle at auction in June came in at $10,192. One reason year-over-year prices are up, of course, is the ever-expanding used supply, due to the influx of lease returns hitting the market this year.
“Average wholesale used-vehicle prices fell significantly again in June relative to May, though they remained higher than year-ago levels,” said Kontos. “Besides seasonal factors, supply growth is continuing to put downward pressure on prices, though this impact remains somewhat masked by a ‘richer mix’ of higher-priced off-rental manufacturers program vehicles and off-lease units discussed in previous commentaries.”
And though used-vehicle retail sales were still relatively high this past month, numbers were down a bit from May.
According to NADA data, there were nearly 4.4 million used sales in June. That compares to 4.3 million used sales in the same month of 2014. Through June, there have been close to 18.6 million used sales, against 18.4 million in the first half of 2014.
More on wholesale values
As for wholesale price movement last month, both compact cars and the SUV model classes saw some market correction this past month, Kontos pointed out.
The compact cars saw prices drop by 4.7 percent this past month from May, which represents a 0.3-percent increase year-over-year. The segment ended the month with an average price of $6,883. This is compared to the overall average price for cars of $8,878 last month, which was down 2.3 percent from May.
The midsize cars also saw prices drop more than the average rate, with rates falling by 2.9 percent to end the month with an average price of $7,795.
The only car segments to see prices rise at all last month were the luxury car segment (up by 0.6 percent), and the full-size cars, up by a slight 0.1 percent.
“Increased supplies of compact cars played a role in softer prices for those vehicles in June,” said Kontos. “The SUV model classes also saw some correction in prices during the month, though prices remain high for SUVs on a year-over-year basis, as the fuel price environment has been favorable to larger vehicles.”
The SUV segment to see prices drop the most last month was the midsize SUVs, which experienced a drop of 6.3 percent from May to finish June with an average rate of $8,041. Compare this to the average price of trucks in the lanes last month of $11,490, which was down 2.7 percent from May.
Other underperformers included the mini SUV segment with a drop of 4.7 percent, and the fullsize SUVs, which saw prices fall by 5 percent; these segments ended the month with an average price of $13,591 and $11,421, respectively.
As far as what sellers were bringing in the most from auction sales last month, wholesale prices for used vehicles remarketed by manufactures were up 3 percent from May, but down a significant 6.9 percent year-over-year, “as off-rental program vehicles continue to be in high abundance,” said Kontos.
Fleet/lease consignor numbers were down a bit last month, with rates falling 2.6 percent from May and 1.5 percent year-over-year.
“Rental risk vehicles were partly to blame here, as a large number of older, rougher, high-mileage units were de-fleeted,” Kontos explained.
Dealers also saw prices for their sales drop by 2.6 percent versus May, but this number is up 2.7 percent year-over-year.
In June depreciation for cars was significantly higher than for trucks and larger vehicles.
But during the first week of July, some of the larger models began to experience more downward pressure on auction prices.
According to the latest Black Book Market Insights report, the Fourth of July holiday week brought with it large declines in the crossover segments as well as a few other truck categories.
“Cars experienced marginal depreciation, similar to the Fourth of July holiday week trend last year, while Truck values showed the highest weekly decline for the year,” said Anil Goyal, the Black Book vice president of automotive valuation and analytics.
Last week, car prices at auction fell by an average of 0.19 percent, or $23, while trucks experienced a decrease of 0.36 percent, or $58.
This was the first time since May 1 that trucks have seen a higher rate of depreciation than the car segments.
The most significant drop among the truck segments was seen in the full-size CUV segment, which saw a drop of 0.69 percent, or $118, last week.
Compact CUVs also saw significant price declines, dropping by 0.66 percent, or $81, while midsize CUVs experienced a decline of 0.68 percent, or $43.
And though pickups have experienced stronger price retention this spring, the compact pickups (down 0.05 percent, or $7), midsize pickups (down 0.43 percent, or $68) and the full-size pickups (down 0.29 percent, or $56) all saw rates drop last week.
The only segment to see increases over the past four weeks has been the compact SUVs, which saw rates spike by 0.36 percent, or $73, last week.
And though all car segments saw prices drop for the fourth consecutive week, last week’s results marked the smallest decline since May 1.
The largest drops were seen among the full-size cars, which saw prices decrease by 0.35 percent, or $35, and the luxury level cars, which dropped by 0.41 percent, or $84.
On the other hand, Black Book analysts pointed out the premium sport cars “continued to defy” almost all other car segments by outperforming the average depreciation for the past nine weeks.
Last week, the premium sporty cars only saw rates drop by $51, or 0.13 percent.
Black Book personnel also overheard comments in the lanes that reflect last week’s data in regards to slowing depreciation for the car segments.
A buyer in Washington said last week, “Pickups and SUV’s remain strong here; cars stable to down a little.”