After mentioning the latest movement of the Manheim Used Vehicle Value Index during his quarterly conference call on Wednesday, Cox Automotive chief economist Tom Webb touched on a topic that triggers the greatest volume of questions he receives — wholesale price projections.
While Webb didn’t offer any specific figures, he did share some guidance in an attempt to give dealers and finance companies some useful perspective.
“As of late, I’ve been asked numerous times about my opinion about those forecasts calling for a steep decline in wholesale pricing,” Webb said told the call full of Wall Street analysts and the media. “My response is that an increase in supply alone is not enough to cause a collapse in pricing. It would have to be accompanied by weaker retail demand.
“As such, I think models that have a collapse in wholesale pricing for used vehicles but still suggest new-vehicle sales in the 17-plus million range are eternally inconsistent,” he continued.
That 30-second soundbite only seemed to trigger industry observers to ask Webb to offer more forward-looking details. The inquires arrived in light of the Manheim Used Vehicle Value Index — a measure of wholesale prices adjusted for mix, mileage and season — that came in with a reading of 123.9 in June, representing a virtually unchanged mark, as it represented just a 0.1-percent decline from a year ago.
So Webb obliged later in Wednesday’s nearly hour-long call by elaborating on his previous point.
“In terms of the downward pressure, we know there is going to be an increase — and a fairly significant increase — in wholesale supplies in the years going forward with much of that being driven by the off-lease volumes,” said Webb, who thinks off-lease volume could be between 3.5 million and 4 million units by the end of 2018.
“These are vehicles that really have to be sold back into the market,” he continued. “It’s just a matter of what price is going to achieve the equilibrium that you need because these vehicles have to come back in the market. They have to be wholesaled and subsequently retailed again in relatively short order so pricing is a mechanism that adjusts that.
“If you’re measuring wholesale prices as we do in the index, historically it shows relative modest movement,” Webb added. “To say that prices will fall 5 percent next year and 5 percent the year following, that would be a big movement down. The history of the pricing suggests you only get big movements like that when it’s not only wholesale supplies going up but that retail demand is weakening either because of tighter credit conditions or an overall softening in the economy like the recession. That’s what we’ve had in the past.”
Webb closed his thought by reiterating his previously mentioned point about how new cars and light-duty trucks sold at a seasonally adjusted annual rate (SAAR) of 17.1 million in June, down from a 17.7 million pace in May a month he said was boosted by “several calendar quirks,” according to the Cox Automotive expert.
“If you’re looking for back-to-back declines of 5 percent in wholesale pricing as we measure it … it doesn’t mean it’s not going to happen. It certainly would be outside the norms,” Webb said.
More details of latest index reading
Manheim noticed wholesale used-vehicle prices inched up in June after four consecutive months of decline, but Webb indicated the latest reading settled in line with expectations.
“With no surprises and pricing that is in line with analyst expectations, it’s been business as usual for the used-vehicle market in the second quarter,” Webb said.
“With pricing nearly identical to last year at this time, consumers continue to see the value in purchasing used vehicles, which remain a profitable part of a dealer's business,” he continued.
With stable job growth and attractive financing continuing for the retail market for new and used vehicles, Manheim found that the strongest pricing tiers were everything above $15,000. Continuing the trend of weakness, the company also noted vehicles in the $9,000-$11,000 range also showed a significant increase in volume of vehicles offered.
Second quarter wholesale pricing for vehicle segments included:
— Compact-car prices softened 7.2 percent in June relative to a year ago, and once again continued to be the weakest segment.
— Midsize cars remains one of the weaker segments and was also down relative to last year, but saw a much more modest decrease of 0.8 percent.
— Luxury car values fell 0.4 percent over the past year. “Despite a good June, this class continued to underperform the overall market, and within that segment, entry luxury cars remain under the greatest price pressure,” Webb said.
— Pickups and vans once again won the top spot for the strongest vehicle segment with pickups up 6.7 percent and vans up 2.7 percent on a year-over-year basis. Within the van segment, full-size commercial passenger units and cargo vans were especially strong thanks in part to limited inventory.
— SUV and CUV remained virtually identical to the same period a year ago, with a slight decrease of 0.3 percent.
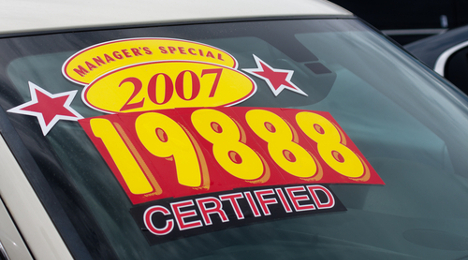
Webb pointed out that it’s expected that the publicly traded dealership groups will show strong vehicle operations when they report their second quarter results. He added that also illustrating the industry's strength, certified pre-owned sales continued their record pace, with sales up 17.6 percent in June and 12.5 percent for the first half of 2015.
“The pricing strength is a testament to solid retail markets, good remarketing practices and greater operating efficiencies,” Webb said.
“While current wholesale pricing is now in line with historic normalcies and market fundamentals, a further acceleration of wholesale inventory combined with seasonal headwinds will likely mean we’ll see price declines,” he went on to say.
In comparing the depreciation patterns of car segments versus those of truck segments, Black Book has noticed a “large disparity” bubbling to the surface.
And this gap might be most notable when taking a gander at the list of month-over-month used-vehicle pricing changes for the 25 individual vehicle segments that Black Book tracks.
The three segments with the biggest sequential used price drops in June were all smaller car types, Black Book pointed out: the entry-level cars (down 4.7 percent), compact cars (3.9 percent) and entry midsize cars (down 3.5 percent).
In fact, the eight biggest declines for the month were all car segments.
Conversely, the seven segments showing the most retention/least depreciation were all trucks, led by the compact SUVs, whose prices climbed 0.8 percent. That segment was the only one (car or truck) to show a month-over-month increase.
Midsize pickups were essentially static from May, while compact pickups and full-size passenger vans dipped 0.2 percent each, full-size cargo vans were off 0.3 percent and full-size CUVs were down 0.5 percent, as were subcompact CUVs (a relatively new vehicle category whose strength Black Book examined closely this spring).
Another sign of this gap is the trending over the past three months. Overall car segments have seen a 4.7-percent price drop. Trucks have been fairly static, down just 0.6 percent.
“The disparity between car and truck depreciation has definitely shown itself over the last few months, driven largely by the hot demand for trucks throughout 2015,” said Anil Goyal, vice president of automotive valuation and analytics for Black Book.
In June, car prices fell 2.5 percent month-over-month and trucks fell 0.9 percent. The 12-month change for cars has been a 16.5-percent downturn, with trucks falling 10 percent.
With the exception or the premium sporty cars, which traditionally see a boost in price closer to the summer months, all car segments are seeing historically expected price declines in the lanes.
That said, according to the latest Black Book Market Insights report, trucks continue to “defy” seasonal patterns, holding strong retention at auction.
Overall, car values fell by 0.53 percent or $65 last week, similar to this time last year when rates fell by 0.48 percent.
On the other hand, trucks only fell by 0.22 percent or $35 in the lanes last week.
For the car segments, all categories saw prices fall by more than a quarter percent in value. The pack was led by entry-level cars, with a decline of 0.82 percent or $56 and entry midsize vehicles, with a drop of 0.81 percent or $75.
This is the 11th consecutive week entry-level cars have underperformed compared to the market as a whole.
“Continued softness is expected during summer months as buyers are pushing prices down on volume-heavy car segments,” said Anil Goyal, vice president of automotive valuation and analytics.
And though the premium sporty cars saw much better retention than the two worst performers, they still lost $103 or 0.27 percent of their value last week.
That said, the premium sporty segment has seen better retention compared to the overall car average for eight weeks in a row.
Trucks are also defying seasonal patterns by holding stronger retention through the early summer weeks, Black Book pointed out.
For example, since May 1, cars have seen prices drop by a total of 3.8 percent, while trucks have only declined by 1 percent, according to Black Book data.
This past week, the compact pickups and midsize pickups saw prices increase by 0.26 percent, while the compact SUV segment saw an increase of 0.16 percent.
These were the only three segments to see prices increase in the lanes last week.
And although a few segments continue to buck trends, the overall industry sentiment still seems to be that of a summer slowdown.
Black Book personnel heard one buyer in the lanes from North Carolina express the following: “Slowing down and prices dropping on average vehicles,” which is in line with market correction for segments that perform particularly well during tax season.
Sporty cars and trucks were the only segments to withstand stronger downward pressure on wholesale prices at auctions.
These two groups remained ahead for price retention, while most other car values experienced steeper declines.
In fact, car prices fell by 0.76 percent or $94, which is the largest decline seen in 52 weeks, according to Black Book’s latest Market Insights Report.
“Mainstream car values declined sharply with the arrival of summer while most truck segments continue to show steady depreciation trends,” said Anil Goyal, vice president of automotive valuation and analytics.
Truck segments saw an overall decline in price of 0.25 percent or $41.
“The Black Book editors and survey personnel have identified select trends this week that show where dealers and remarketers need to pay close attention to inventory management strategies,” the report stated. “Volume-heavy segments, summer-favorite models and late-model units from off-rental are all having an impact on supply currently.”
For example, popular, volume-heavy segments such as the compact, entry level, entry midsize, full-size and upper midsize cars, all saw prices drop by about 1 percent last week.
Black Book analysts said they also weren’t surprised that sporty cars are in high demand as we enter the summer months, putting positive pressure on auction rates. Sporty cars bucked the average trend and only saw a 0.26-percent or $42 decline last week.
Trucks once again performed better in the lanes last week, with pickups and SUVs outpacing the car segments.
The compact SUV segment even saw a slight price increase of 0.11 percent or $21 — the only segment to see prices rise last week. Full-size SUVs also performed well with a slight decline of 0.13 percent or $25.
Compact pickups (down 0.45 percent or $67), midsize pickups (down 0.31 percent or $38) and the full-size pickups (down 0.31 percent or $59) also performed better than the industry average.
Once again, Black Book pointed out buyers in the lanes are being very selective on 2014 and 2015 models and many no-sales passed through the lanes last week.
Buyers are being very selective on 2014 and 2015 models, and many have been chalked up as “no-sales” this past week.
This could be due in part to just how many of these units are in the lanes, as Black Book personnel overheard a buyer from Nashville, Tenn., say, “Rentals are not doing well as there are too many available.”
Comments also reflected dropping prices as we hit the summer slowdown. A buyer from Washington said, “Good sale with plenty of product, but prices are down a little on many.”
Considering the prolific nature of the current certified pre-owned vehicle market, iSeeCars.com decided to look a bit further into the CPO programs provided by manufacturers to see exactly how much of a premium their programs carry.
As it turns out, the majority of car brands average less than $1,000 extra for their CPO vehicles when matched to comparable non-certified vehicles. Overall, the average “premium” was $722, or an average increase of 2.9 percent.
iSeeCars.com highlighted the nine car brands with the lowest manufacturer-provided CPO premiums, which were all on average less than $500, as seen in the chart it provided.
A portion of FCA’s wheelhouse, Jeep, Dodge and Ram, make up the cheapest average CPO premiums on the list, with Chrysler coming in at No. 7. Japanese manufacturers Subaru, Honda and Mazda comprise the middle of the list while General Motors’ Chevrolet and Buick brands round out the bottom of the nine.
“Looking at the manufacturers with what are typically considered the best CPO programs, our analysis found some real bargains that can make buying a certified pre-owned car very compelling,” said Phong Ly, iSeeCars.com’s chief executive officer. “The data indicates that consumers are more likely to find a CPO car at a highly competitive price from the top brands on our list. However, they should also pay careful attention to what’s included in the certification.”
The company’s study analyzed over 3.5 million used vehicles, with a model-year range of 2010 to 2015, sold between Nov. 1, 2014 and April 30 of this year. The vehicles were limited to mileages of 70,000 miles or less. For each vehicle, the average price of the manufacturer CPO vehicle was compared to the average price of a comparable non-certified used vehicle. The company’s data excluded vehicles with fewer than 10 CPO sales as well as vehicles with non-certified mileage outside of the range of 15 percent of the average CPO vehicle’s mileage. Abnormal pricing outliers were also excluded.
For more details, the report from iSeeCars.com can be downloaded here.
Though pickup prices have begun to weaken a bit as summer approaches, cars are still seeing prices dip at a much faster rate.
Part of this trend is due to increasing inventory, which is allowing dealers to be choosier about the units they buy for their lots.
“As buyers remain picky about units, car segments followed continued seasonal declines while pickups showed some resilience,” said Anil Goyal, Black Book vice president of automotive valuation and analytics, in the company’s latest Market Insights report.
Goyal explained last week in the lanes showed inconsistent buyer demand, and price softness reflected this trend.
Overall, the car segment prices fell by an average of 0.34 percent or $42 last week, while trucks dropped by a slight 0.17 percent or $28.
Comments in the lanes reflected a weaker market, as well. One buyer from Nevada said, “A lot of hesitation to make purchases here; retail market still a little slow,” while a comment overheard in Nashville, Tenn., by Black Book staff noted, “The market was slow here again this week, lots of no-sales.”
Pointing out a few trends, in particular, Black Book editors reported prices for entry-level cars continue to drop at a rapid pace. In fact, the segment has seen nine consecutive weeks of higher-than-average depreciation.
Last week, the entry-level cars saw prices drop by 1.01 percent or $70, the biggest decline of any segment Black Book tracks.
On the other hand, the premium sporty and near-luxury cars continued to outperform the car group average for the 6th straight week.
The premium sporty segment experienced a price decline of 0.12 percent or $45 last week, while the near-luxury cars dropped by 0.25 percent or $77.
On the truck side of the market, compact SUVs (up by 0.16 percent or $32), and cargo vans (up 0.16 percent or $23) experienced the biggest price increases last week.
The compact pickups (up 0.01 percent or $1) and full-size CUVs (up 0.03 percent or $5) also saw slight increases.
On the other hand, the midsize CUVs also experienced significant rate declines last week, showing the highest depreciation for the segment in 18 weeks. The midsize CUVs dropped by 0.30 or $48.
Used vehicle deprecation in May accelerated at a quick pace after tax season came to a close, but price drops in the lanes are expected to slow this month.
Last month saw depreciation ramp up to the fastest rate seen in more than six months. That’s according to the latest edition of Guidelines from NADA Used Car Guide, which stated prices of vehicles up to 8 years in age fell by 3.2 percent from April rates.
This is the biggest drop on record since last October, when prices fell by 3.6 percent in the lanes.
NADA UCG analysts tie the accelerated depreciation rates to two factors: Weak demand for compact and mid-size cars and two full weekends of Memorial Day new-vehicle promotions.
Last month’s decline was also the worst performance for May since 1995, and pushed NADA Used Car Guide’s seasonally-adjusted used vehicle price index to 123.8, down 0.5 percent from April and 2 percent lower than last May 2014.
Tax season brought with it the usual interest in smaller, more affordable vehicles, and now these segments are feeling the impact of market corrections.
NADA UCG also reported the subcompact, compact and mid-size car segments are also feeling the impact of new market promotions and incentives, as well as the fact that many consumers are turning to the truck and utility vehicles.
Consequently, subcompact, compact and mid-size car prices fell by an average of 3.7 percent in May.
And compact utilities saw a significant decline in May, as well, with prices dropping off by 3.4 percent.
And of course, these declines are also tied to growing supply. Year-over-year, auction volume was 7 percent higher in May than it was last year and is also up 7 percent year-to-date.
Luxury, mid-size and large car prices fell off by 3 percent in May, while midsize utility vehicle and van prices slid at a softer pace of 2.4 percent.
Once again, large pickups and SUV prices remained strong, with prices only dropping by about 1 percent a piece last month.
In fact, on an annual basis, NADA UCG pointed out large pickups continue to outperform the market. According to NADA data, through the first five months of the year, prices for pickups were 7.1 percent higher in May than they were during the same period last year.
And even though summer normally brings with it lower prices at auction, NADA UCG predicted depreciation to slow somewhat in June compared to the higher rate recorded in May.
NADA UCG expects used prices to drop by an average of 2 to 2.5 percent in June.
Cars are once again expected to see higher rates of depreciation than trucks.
Subcompact, compact, and mid-size car prices are expected to fall by roughly 2.5 percent, while mid-size van and utility losses should be more mild.
Large pickups and SUVs are expected to see price drops of less than 2 percent, and luxury mid-size and large car depreciation is predicted to come in at about 2.5 percent.
In a recent report posted to its website, Cars.com observed a retail used-car pricing trend similar to what has happened on the wholesale side of the market: prices on fuel-efficient and alternative-powertrain cars remain among the steepest decliners.
In fact, the company’s analysis of 2012- to 2014-model-year used-car listings posted to the site found that the Smart ForTwo had the largest retail price decline (5.2 percent) from May 1 to May 31. And the Nissan LEAF wasn’t far behind at 5.1 percent.
“Fuel-efficient and alternative-powertrain cars continue to top the list of vehicles with the biggest price drops, as the nationwide average for a gallon of gas remains relatively low,” Cars.com senior editor Mike Hanley, who authored the post, said in the report.
“Three of the top five models with the biggest price decreases in May — the Smart ForTwo, Nissan Leaf and Toyota Prius Plug-in — are small or efficiency-minded vehicles; their prices were down 5.2 percent ($544), 5.1 percent ($734) and 3.2 percent ($735), respectively,” he added.
For the full top 10 lists of vehicle price changes in May, see the complete recap from Cars.com.
As far as auction values, Kelley Blue Book found that electrics led the decline in May.
In its latest Blue Book Market Report, KBB analyzed the changes in Kelley Blue Book Auction Values of 2012- to 2014-model-year vehicles.
The segment with the largest decline between May 1 and May 29 was the electric vehicle class, down 3.6 percent. In April, their values fell 8.5 percent.
Subcompact cars had the second-steepest drop in May at 3.3 percent, followed by compact cars (2.5 percent), midsize cars (down 2.4 percent) and luxury cars (down 2.2 percent), according to the KBB report.
And while they were ahead of the curve actually in the front half of the top pricing performers for May, hybrid/alternative-energy car values were still down 0.7 percent. (The average segment was down 1 percent).
The KBB report also speaks to the fuel-price dynamic and how it is influencing segment vehicle value trends.
Interestingly enough, there was a 6.2-percent increase in gas prices during May, and there has been a 10.9-percent increase since April 1, KBB said.
That said, fuel costs are still relatively low, so they’re not impacting hybrid and electric car values as much as they did in the past, the report noted.
“When comparing the 2015 low in late-January to the current national average price per gallon of regular fuel, consumers are paying 62 cents, or 31 percent, more per gallon,” said Sean Foyil, analyst for Kelley Blue Book.
“The market hasn’t seen this much of a rise in fuel prices in such a short amount of time since 2013, when fuel prices jumped 49 cents from January to February. However, despite the recent increase in fuel prices, the current price is still $1, or 28 percent, cheaper per gallon than at this time in both 2013 and 2014,” he added.
Last week, auction price depreciation broadened across the board, continuing a downward trajectory that began in May after tax season came to a close and one that will likely continue through the summer.
According to Black Book data, the average price of a used vehicle for models years 2009-2013 fell by 1.2 percent month-over-month in May.
Import cars saw the biggest declines with prices falling by 2 percent in May. Next up were domestic cars with a decline of 1.4 percent.
Once again, trucks were outperforming cars: domestic truck prices dropped by 0.8 percent, and import truck rates fell by 0.4 percent.
“The month of May saw a noticeable swing from beginning to end, and while overall depreciation finished at just -1.2 percent, the end of the month started to pick up steam,” said Anil Goyal, vice president of automotive valuation and analytics.
The largest depreciation rate was seen among the compact SUVs, which might be a natural market correction as this segment saw the strongest price retention in April. Last month, compact SUVs lost 3.6 percent (or $889) of their value to finish the month with an average price of $24,129. This represents a 3.9-percent drop year-over-year.
And while pickup depreciation is starting to ramp up — last week, trucks saw prices fall by an average of 0.28 percent, or $46 — they were still performing above the industry average in May.
In fact, compact pickups saw the strongest price retention in May, with prices rising by 1 percent. Compact pickups finished the month with an average price in the lanes of $18,290. And though rates were up from April, as used supply continues to expand, prices are being pushed down from 2014 rates. The average auction price for compact pickups in May represents a 4.5-percent year-over-year drop.
Not surprisingly after the tax season rush, seven of the top nine largest depreciating segments last month were cars: the upper midsize (-2.9 percent or -$350); entry-level (-2.8 percent or -$215); entry midsize (-2.6 percent or -$248); compact (-2.4 percent or -$220); prestige luxury (-1.7 percent or $582); luxury (-1.6 percent or -$345); and full-size (-1.4 percent or -$177).
Out of the car segments, premium sporty cars finished the month with the best retention, perhaps a result or warming weather and increasing consumer interest in sportier models. Prices for this segment stayed flat in May from April levels to finish the month at an average rate of $39,297. This is down a significant 13.3 percent from last May’s rate or $45,307.
Where Vehicle Equity is Headed
As for what’s in store for the coming months, Goyal said, “We anticipate June will show the beginning of summer seasonal patterns, with many vehicles showing ‘no sales’ at auctions due to lower buyer demand.”
And a report released by NADA Used Car Guide titled, “Vehicle Equity: Managing the Risk Ahead,” warns that depreciation trends aren’t predicted to slow down anytime soon.
In fact, NADA UCG expects depreciation of vehicles up to 8 years old to jump from an estimated 14 percent in 2015 to an average near 18 percent in 2016 and 2017.
When new-vehicle sales dropped off dramatically during the economic downturn of 2007, used supply took a huge hit, as well.
In fact, the drop-off in new sales and the resulting tight used supply combined to push used prices up by 18 percent since 2007, according to NADA UCG.
But now, the tides have turned with leasing picking up. Lease volume reached 3.2 million units in 2014. This is ramping up used supply growth, NADA UCG pointed out, because these leased vehicles are coming back into the market much quicker than purchased vehicles.
But that’s not all — NADA UCG highlighted two other less-discussed factors that are playing a role in used supply and the consequent pre-owned vehicle depreciation, as well.
NADA UCG explained worsening credit conditions will work against used prices in the near future.
“The Federal Reserve decision to raise short-term interest rates expected in Q3 2015 will push auto loan rates higher for the first time in a decade, although rates will likely rise slowly over an extended period,” the report stated. “Credit conditions will continue to be favorable for some time, but not at quite the same unprecedented level.”
New-vehicle sales growth is also expected to slow, which may cause automakers to ramp up incentives, putting downward pressure on used rates.
“The effort to meet manufacturers’ new sales expectations will result ina level of production unlikely to clear the market without price reductions,” the report said.
NADA UCG expects a combination of more used supply, weaker credit conditions and new-vehicle pricing pressure will combine to create much higher rates of depreciation over the next few years.
In Tuesday’s Auto Remarketing Today, we recapped Kelley Blue Book’s analysis on the used-car segments with the greatest movements (up or down) in auction prices during May.
And now, we’ll show you which individual models saw their values change the most during the month.
The latest Blue Book Market Report breaks down the top 10 and bottom 10 performing models in May, based on Kelley Blue Book Auction Values on model-year 2012 through 2014 vehicles.
Starting at the top, the vehicle with the most positive movement during the month was the Mitsubishi Eclipse, whose values went up 3.7 percent over the four-week period. It was followed by the Ford E-350 Super Duty Passenger, with a 2.9-percent gain.
The complete top 10 performing models in KBB’s data set is below, with four-week increase in parenthesis:
Mitsubishi Eclipse (3.7 percent)
Ford E-350 Super Duty Passenger (2.9 percent)
Cadillac ATS (2.8 percent)
Chevrolet Colorado Crew Cab (2.7 percent)
Mazda CX-7 (2.5 percent)
Chevrolet Silverado 1500 Extended Cab (2.2 percent)
Ford F-150 Super Cab (2.2 percent)
Toyota Tundra Double Cab 2.2 (percent)
Porsche Boxster (2.1 percent)
GMC Sierra 1500 Extended Cab (2.0 percent)
Conversely, the Nissan LEAF had the biggest drop in auction value at 8.1 percent, followed by the Kia Rio at 6.1 percent.
The full list of the 10 biggest declines are listed below, with percentage decline in parenthesis, again provided by KBB:
Nissan LEAF (8.1 percent)
Kia Rio (6.1 percent)
Chevrolet Spark (4.7 percent)
Lexus CT (4.5 percent)
Chevrolet Sonic (4.3 percent)
Mitsubishi i-MiEV (4.3 percent)
Smart fortwo (4.1 percent)
Ford Fusion (4.1 percent)
Hyundai Elantra (4.1 percent)
Hyundai Accent (4.1 percent)