According to ADESA data, auction prices were up slightly in April. However, analysts say there is more to the story.
In the latest edition of Kontos Kommentary, executive vice president of ADESA Analytical Services Tom Kontos said the bump in auction prices — a 0.07-percent increase from March — is due in part to the type of models flowing through the lanes.
“Average wholesale used-vehicle prices were up on both a month-over-month and year-over-year basis again in April, but again this was mostly due to a significant proportion of sales of higher priced, late-model, off-rental, manufacturer program vehicles, which elevated average prices,” said Kontos. “Drilling down into these averages reveals softness in institutional sales prices that reflects growth in supply.”
According to ADESA Analytical Services monthly data, vehicles in the lanes in April went for an average of $10,711, which is up 2.2 percent year-over-year.
And much like trends seen in late spring and summer of last year, the SUVs and truck segments are faring well, while cars and crossovers are seeing a bit of a decline after tax-season highs.
Car segment prices were up a meager 0.1 percent from March and year-over-year, while the trucks saw prices rise by 2.1 percent on a monthly basis, and 9.3 percent from April 2014.
Midsize and compact car prices were on the way down in April, falling by 3.8 percent and 1.4 percent, respectively, from March levels. This trend is common for this time of year, as these segments represent the majority of tax-season buys.
The luxury car segment saw the biggest price increase among the cars, with an increase of 0.9 percent from March.
On the truck side of the market, the largest price spikes were seen among the luxury SUV and midsize SUV segments, which rose by 4.7 percent and 3.3 percent, respectively.
The pickups are performing strongly, as well, as compact pickups rose by 3 percent and fullsize pickup prices were up by 2.1 percent.
Taking a look at seller performance last month, Kontos pointed out dealer consignors saw the biggest monthly increase in price for vehicle remarketed, with rates rising by 1.8 percent month-over-month and 2.2 percent year-over-year.
Next up was the manufacturers, whose remarketing prices were up 1.7 percent from March, but down 7.6 percent from April 2014. Lastly, prices for fleet/lease consignors were down 0.2 percent sequentially and down 1.4 percent annually.
As tax season came to an end, prices in the lanes began falling in April.
According to NADA data, auction prices declined by 1.4 percent last month, causing its Used Vehicle Price Index to fall to 124.3, down from March’s level of 124.5
And per seasonal norms, that pace of decline is expected to pick up this month and into the summer.
According to NADA Used Car Guide’s latest Guidelines report, prices of used vehicles up to 8 years old are expected to see prices decline by 2.7 percent in May, followed by a 2-percent drop in June.
If the results add up, the price declines for the two months will match last year’s rate trends at auction, NADA UCG analysts pointed out.
On a segment basis, subcompact, compact and midsize car prices are expected to see prices fall by almost 3 percent this month. This trend could be in part due to market correction after prices for these units spiked earlier in the year due to tax-season interest.
According to the report, midsize utilities, large SUVs and large pickup prices are expected to drop by 2.5 percent, slightly slower than the expected average.
Luxury segment price movement is expected to vary, with rates dropping within the range of 2.5 to 3.5 percent. NADA UCG reported the bigger losses will be seen in the luxury midsize and large car segments.
In April, according to the report, cars fared worse than trucks, a reoccurring theme from 2014 that has shown up once again this spring.
Some of the biggest price declines last month were seen in the car segments, with subcompact and mid-size car prices falling by an average of 1.7 percent compared to March, while compact car prices fell off by 1.4 percent.
The midsize van segment was the only truck segment last month to see a similar depreciation slide as the car segments, with rates falling by 1.6 percent.
In comparison, depreciation for both mainstream and luxury pickups and utilities averaged just 0.6 percent.
Many in the industry may have wondered why prices in the collectible car market have been soaring as of late.
In fact, according to Black Book data, exotic vehicles appreciated by 38.3 percent year-over-year in April.
For those wondering, Black Book analysts are attributing part of this steep price increase to what they are coining, the “Instagram Effect.”
Black Book reported that social networking has a lot to do with recent trends in the exotic car segment: “Affluent collectors have been exposed to the images posted by celebrity buyers on social media sites such as Instagram, fueling even higher demand for certain exotic vehicles,” said Eric Lawrence, director of specialty products at Black Book.
“Younger affluent audiences want what celebrities like Floyd Mayweather and the Kardashians flash on their social media accounts, for example,” Lawrence added.
To back up this assertion, Black Book analysts took a look at auction prices of exotic collectibles, closely following the Aston Martin DB5 Coupe, the Ferrari 250 GTL Lusso and the Mercedes-Benz 300SL Gullwing.
According to Black Book data, from 1977 through 2008, each vehicle appreciated roughly 5 percent each year.
Compare this to a change of 20 percent to 60 percent annually since 2008, and Black Book analysts were prompted to say, “A new, younger generation of collector has taken to this genre of exotic sports cars, and auction prices are going for a ride.”
The average price for a DB5 Coupe these days is $700,000, up from $75,000 in 2008. The 250 GTL Lusso now goes for $1.8 million, up from $315,000 in 2008. Lastly, the 300SL Gullwing went for an average of $415,00o in 2008, but these days you will have to shell out close to $1.5 million.
As seasonal strength wanes, trends seen throughout 2014 in the auction lanes are showing up once again.
That is, truck values remain stable as car prices are starting to slide, as we approach the summer sales slowdown.
In the latest Black Book Market Insights Report, analysts reported that a growing number of car segments are seeing greater week-over-week price declines at auction as weather warms.
In fact, the near-luxury segment was the only car segment to see a positive increase last week, rising by 0.04 percent — a mere $8.
“As anticipated, car values have started to decline after an extended spring season while trucks continue to hold values relatively well,” said Anil Goyal, vice president of automotive valuation and analytics at Black Book.
Overall, the car segments saw prices drop by an average of 0.43 percent ($53), according to Black Book data.
The car segment pushing rates down the most was the upper midsize cars, which saw rates drop by 0.092 percent ($114). They were followed by the entry midsize car segment with a 0.63-percent ($66) decline.
Black Book analysts also pointed out the mainstream hybrid and electric vehicle values are soft, as well, as fuel prices remain low.
Trucks on the other hand continue to show solid strength in the market, Black Book reported.
And seven of the truck segments Black Book tracks either remained unchanged or saw price upticks this past week.
Overall, truck segments saw prices rise by 0.07 percent, or $12, last week.
The compact pickups stood out with the highest price increase, rising by $93 (0.62 percent). Full-size pickups also proved strong, with rates spiking by $98, or 0.50 percent.
The largest dollar decline among truck segments was seen among the luxury SUVs, with a price drop of $106.
Black Book editors and personnel also heard many dealer express last week they have noticed car values softening, as well, as the spring market comes to an end.
A buyer from Georgia said, “Car value have to start softening, but trucks remain strong,” while a auction attendee from Phoenix reported, “Auctioneers say things are slowing down a bit.”
Ford Motor Co. vehicles took four of the top 10 spots in the latest list from Cars.com outlining the steepest used-car price hikes for April.
According to this report written by Mike Hanley of Cars.com, the 2012 to 2014 model-year used car with the biggest increase in asking price last month was the Lincoln MKZ, which had a 3.1-percent increase from April 1 to April 30.
Other vehicles in the Ford family to crack the top 10, according to the Cars.com charts from Paul Dolan, were the Lincoln MKZ Hybrid at No. 6 (up 1.7 percent), Ford Expedition EL at No. 9 (up 1.5 percent) and the Ford Flex at No. 10 (up 1.5 percent).
Conversely, the Nissan Leaf had the biggest used-car price decrease for the second straight month (down 4.7 percent).
“Gas prices aren't driving demand for alternative-fuel cars like the Leaf,” Hanley wrote in the post. “Even though the national average for a gallon of regular has been moving up in recent weeks and now stands around $2.65, according to AAA, it's still about a dollar less than a year ago when the average for a gallon of regular was $3.67.”
Hanley also points out that luxury vehicles accounted for seven of 10 biggest price declines last month, including the No. 2 (Land Rover Range Rover SUV, down 3.3 percent) and No. 3 (Porsche Panamera, down 2.9 percent) spots.
Both top 10 lists can be found in the full report.
Note: Models eligible for the list had to be from the 2012, 2013 or 2014 model years and have a minimum of 250 units in the Cars.com national search listings.
It turns out prices in the lanes stayed consistent last month, even as April marked the end of tax season and historically the market strength that comes with it.
According to Black Book data, the average wholesale prices for vehicles model years 2009 through 2013 went largely unchanged last month.
“The fact that we’re looking at overall unchanged depreciation levels across used-vehicle segments in late April is a testament to the stretched spring season we’ve had this year,” said Anil Goyal, vice president of automotive valuation and analytics for Black Book. “Looking ahead, it will be interesting to see if the remainder of the year will outperform market expectations.”
The price movement that did occur was slight: domestic cars saw prices rise by 1.1 percent; import car prices fell by 0.8 percent; domestic trucks rose 1.5 percent; and import truck prices dropped 0.2 percent.
Though average price changes were mild, the premium sporty cars saw the largest price drop in April, with rates falling by 1.3 percent late month to finish the month with an average price of $45,048. This is down 13.6 percent year-over-year.
The second-highest rate of depreciation last month was seen among the luxury cars, which saw prices fall by 1 percent.
The full-size CUVs also saw a bit of a downturn, with price falling by 0.8 percent to end the month at an average value of $24,626.
Ending the month with the strongest price retention were the compact SUVs. Rates for this segment grew by 2.8 percent in April, ending the month with an average price of $19,783, which is down 3.9 percent from year-ago levels.
Black Book editors also reported the industry experienced “the final push from the spring tax buying season” last month.
The entry-level car (up 0.1 percent), upper midsize car (up 1 percent) and full-size car (up 0.1 percent) segments all saw prices rise last month, normally popular segments for tax season.
They were joined by three truck segments also showing monthly increases: the full-size cargo vans (up 0.3 percent), compact CUV (up 0.4 percent) and full-size passenger vans (up 0.5 percent).
The April collectible car market continued strength trends seen earlier this year, and prompted Black Book editors to cite value appreciation in this market area as “astounding.”
The collectible cars market is performing well, with exotic cars seeing the highest year-over-year change.
The exotic vehicles saw a 38.3-percent year-over-year jump in price this past month, and sports cars followed closely behind with a 26.73-percent spike.
Classic trucks jumped in price by 4.05 percent, with pony cars (3.55 percent), American classics (2.22 percent) and muscle cars (0.86 percent) rounding out the pack.
“Collectible cars continue to appreciate at an astounding pace, extending the pattern we have been seeing for the last few years. Although vintage exotics still lead the way, later model exotics and near-exotics are coming on strong,” said Eric Lawrence, director of specialty markets for Black Book.
Black Book editors also pointed out that the Ferrari 308/328s, Lamborghini Countach 5000s and early Porsche 911 turbos have all jumped in value during the last year, “as collectors who are either on a more limited budget or those looking for the ‘next big thing’ have gone on a spending spree.”
Furthering this assertion, two recent auctions in Florida — Auctions America’s Fort Lauderdale and Barrett-Jackson’s Palm Beach sales — separately broke the $20 million mark in sales.
Notable sales from the auctions included:
- 1959 Ferrari 250 GT Coupe: $715,000 (Auctions America’s)
- 1987 Lamborghini Countach 5000 QV: $335,000 (Auctions America’s)
- 2006 Ford GT Heritage Coupe: $410,000 (Auction America’s)
- 1970 Plymouth Superbird 440-6 pack: $165,000 (Barrett-Jackson)
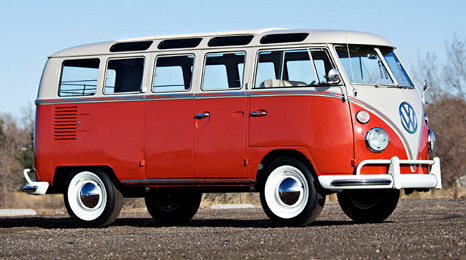
- 1965 VW 21 window bus: $70,000 (Barrett-Jackson)
- 1954 Kaiser Darrin Convertible: $165,000 (Barrett-Jackson)
Black Book reported similar reports of an appreciating collectible car inventory in its March report. Over the course of January to March, exotic car prices rose by 3.61 percent, while sports cars saw rates rise by 3.7 percent over the same period. Classic trucks bumped up by 0.72 percent; pony cars saw prices increase by 0.65 percent; and lastly, muscle cars jumped up by 0.9 percent.
As we come to the end of the spring selling season and tax-time highs, one branch of the market isn’t losing momentum.
The truck market continues to be strong, said industry analysts in the latest Black Book Market Insights report.
In fact, the Black Book editors explained they are tracking a continued pattern of strength across several truck segments, particularly crossovers.
Overall, wholesale prices for trucks increased by 0.22 percent or $37 last week.
Some of the strongest performing segments were smaller units in the truck category. For example, the company saw compact pickup rates rise by 0.62 percent or $92, while compact SUVs saw prices spike by 0.89 percent or $179. The only truck segments to see prices drop last week were the full-size CUVs, with prices dropping by 0.23 percent or $40, and the luxury SUVs, which saw prices drop by 0.9 percent or $28.
The car segments performed a bit weaker last week, with overall values dropping by 0.15 percent.
And certain luxury cars, in particular, are showing growing weakness, Black Book editors pointed out.
While mainstream brand cars showed stable prices last week, luxury level cars declined by as much as 0.67 percent, according to Black Book data.
“Interesting trends developed among different segments as luxury cars declined, mainstream brand cars remained stable and trucks continued to show strength,” said Anil Goyal, Vice President of Automotive Valuation and Analytics.
The only car segment to see a lift in prices last week was the full-size cars, with rates rising by 0.08 percent.
Spring might seem to have barely started weather-wise in places such as Michigan that saw snow flurries as recently as seven days ago. But according to the latest edition of Black Book Market Insights, spring might well be nearly finished in the auction lanes.
Black Book editors acknowledged that they began to see signs of a tiring spring tax season when they compiled last week’s report. When the editors shared their latest analysis on Wednesday, they indicated those signs became more obvious.
This week’s data showed the largest drop off of the spring for car and truck segments.
In particular focus this week, Black Book noticed the full-size car and upper midsize car segments have continued to perform well in the used market. Editors mentioned three drivers creating this movement may be:
— Low gas prices continue to place stress on smaller car segments.
— The continuously improving economy is incentivizing buyers to consider cars with a little more size.
— Relatively lower supply of full-size cars as compared to compact cars to meet the increased demand.
“The spring market strength is starting to wane as most segments showed slight decline or remained flat in wholesale values last week,” said Anil Goyal, vice president of automotive valuation and analytics at Black Book.
Goyal mentioned a half dozen other developments Black Book editors uncovered, including:
• Overall, the volume-weighted car values decreased by 0.11 percent from last week.
• Overall, the volume-weighted truck values were flat from last week.
• All car segments except full-size car and upper midsize car dropped in value.
• Most truck segments did not change much except for full-size CUV, full-size passenger van and luxury SUV segments which dropped more than 0.4 percent from last week.
• The top three truck segments with the most cumulative value increase over the last eight weeks are compact SUV (up 2.7 percent), full-size pickup (up 2.0 percent) and full-size cargo van (up 1.6 percent).
• The top three car segments with the most cumulative value increase over the last eight weeks are upper midsize car (up 1.5 percent), entry-level car (up 1.5 percent) and compact car (up 1.4 percent).
Along with the data trends, Black Book also shared some dealer comments gathered from the more than 60 auctions representatives attend each week.
A dealer from Minneapolis said, “Internet activity strong today on late-model low-mileage units,” while another dealer from Nashville, Tenn., added, “Plenty of selection but floors still up so a lot of no-sales here today.”
An attendee at a sale in Illinois noted, “Prices are very strong here due to low inventory of clean cars,” as a bidder at a Florida auction noticed, “More no-sales here this week than normally.”
Finally, a buyer in Atlanta touched on some specific units, saying, “Lots of no sales, but pickup trucks and passenger vans continue to be in high demand.”
The entire Black Book report can be downloaded here.
Here’s some trivia for you.
If you took all the drivers trading in hybrids and electric vehicles this year, what type of vehicle did about 22 percent of those folks end up buying in return?
If you said “a new SUV,” you’re correct.
This somewhat surprising statistic was shared recently by Edmunds.com, whose analysis illustrates an escalating movement away from these alternative-fuel vehicles to “gas-guzzling” rides, given the dip in fuel costs.
While more than a fifth of alt-fuel trade-ins are going towards SUV purchases this year, that figure was at just 11.9 percent in 2012, Edmunds said. In 2014, it was 18.8 percent.
One statistic that is perhaps even more surprising than the ones above is this one from Edmunds: after previously never dipping below 50 percent, alt-fuel loyalty rates (the percent of hybrid/EVs trade-ins going toward purchase of another alt-fuel vehicle) have fallen to 45 percent this year.
In 2012, that rate was over 60 percent.
“For better or worse, it looks like many hybrid and EV owners are driven more by financial motives rather than a responsibility to the environment,” says Edmunds.com director of industry analysis Jessica Caldwell.
“Three years ago, when gas was at near-record highs, it was a lot easier to rationalize the price premiums on alternative fuel vehicles,” she added. “But with today’s gas prices as low as they are, the math just doesn’t make a very compelling case.”
The scenario Caldwell describes plays into the challenges that electric vehicles, in particular, are finding in the used-car market. In its latest Perspective report that delves into an “Electric Vehicle Retention Report Card,” NADA Used Car Guide pointed out a few factors at work.
“For the most part, used EV prices continue to be very soft, which really isn’t much of a departure from how prices have tracked over the past couple of years,” NADA UCG said in the report. “Used EV demand continues to be hampered by range and technology concerns, as well as by stiff competition from highly efficient — and more affordable — gasoline-powered cars.”
Certainly, when looking at retention rates for electric vehicles, there are some strong performers in the data set, particularly the luxury EVs, which have by and large beaten mainstream EVs in terms of holding on to their value, according to NADA Used Car Guide.
Additionally, the Tesla Model S is particularly strong. The Perspective report ranks 1-, 2-, and 3-year-old EV models by retention percentage, based on data from NADA Used Guide and ALG.
The Model S tops all three of those charts with respective scores of 83.1 percent, 71.1 percent and 57.2 percent**
Fuel Costs, Incentives & More
NADA Used Car Guide’s report goes on to discuss the importance of gas prices and governmental incentives on the EV market, which it says cannot be overlooked.
Citing the latest data from the U.S. Energy Information Administration, the report says the average per-gallon cost of gasoline in April is $1.16 lower than a year ago.
“The fact that gasoline prices are more than $1 less per gallon than they were this time last year erodes demand for new and used EVs even further,” analysts said in Perspective. “Substantially lower gasoline prices make it even more difficult to justify an EV purchase from an economic standpoint. Lower gasoline prices combined with ongoing gains in gas-powered vehicle efficiency makes EVs an even harder sell.”
And it might not get much easier in the short term, with average gas prices expected to increase only modestly to $2.61 per gallon by the end of 2016, NADA Used Car Guide said, citing the EIA’s Short-Term Energy Outlook.
“As for encouragement, federal and state tax incentives have been an effective tool for sparking purchases of new EVs to counter the drawbacks potential consumers face,” NADA analysts said. “However, we’re beginning to see budget cuts and other issues which have legislatures reducing or eliminating incentives at the state level.”
The reduction in incentives was of several factors mentioned by Black Book’s Anil Goyal as having some impact on EVs. Goyal, the vice president of automotive valuation and analytics, and his team have observed “significantly lower prices” for electric vehicles (and some hybrids).
A great deal of that price crunch comes the fact there’s a good bit of supply flowing back into the used market, given how many EV sales were done as 24-month leases. Additionally, many consumers are eyeing potential longer-range vehicles that could be in the pipeline. Plus, there’s the whole incentive issue, which has impacted the supply side.
“Some of the supply that was driven into the market was due to the incentive. For example, in Georgia, we had a tax incentive, even on leasing of an electric vehicle, which is now taken away. But, it was very incentive driven, and then of course the gas prices had a good part to play in it,” Goyal said.
“So, as those gas prices have stabilized at a low level, and those incentives are starting to be questioned — at least at the state level — and we hear about newer products with longer-range coming into the market, I think that’s why there is that stress in pricing on those vehicles, with the supply coming back all at once.”
***Editor's Note: At the beginning of the Perspective report, NADA Used Car Guide explains the retention rate calculation as follows: We’ve provided retention figures for the most popular style level as determined by its share of new vehicle sales. While retention for other styles within a model lineup may be better or worse than the ones provided, the differences are generally small and do little to change the model’s overall standing in the used marketplace.
The retention calculation is a function of a three month average (March – May 2015) of NADA’s average trade-in value divided by a vehicle’s typically-equipped Manufacturer Suggested Retail Price (MSRP). Typically-equipped MSRP data was sourced from NADA Used Car Guide and ALG. Note that a vehicle’s rate of depreciation, and ultimately retention, is in part a product of the level of discounting at the time of new. As such, typically-equipped MSRP’s do not include any state or federal tax credits, nor do they include any manufacturer incentives or rebates available at the time of purchase.