Portions of the U.S. are recovering from some of the coldest temperatures in decades and folklore groundhogs are providing mixed forecasts. However, Black Book editors already are seeing depreciation signals of spring being straight ahead.
Reinforced by the assessment of an auction general manager from the Southeast, editors noted in this week’s Market Insights report that early signs of spring arrived with a pair of truck segments showing no depreciation.
“We are starting to see a normalization in depreciation after higher drops at the start of the year. Both car and light truck segments are showing stability in values,” Black Book executive vice president of operations Anil Goyal said in the newest report.
Volume-weighted, Black Book reported overall car segment values decreased by 0.56 percent last week. In comparison, editors mentioned car values decreased by 0.65 percent on average during the prior four-week period.
“In car segments, the depreciation across segments was quite steady,” editors added.
Again volume-weighted, Black Book determined overall truck segment values — including pickups, SUVs and vans — softened by 0.42 percent last week. That’s below the average editors noticed during the previous four weeks when the decline came in at 0.58 percent.
Looking closer at the truck segment, editors noted the compact crossover/SUV segment depreciated the most, sliding by 0.68 percent or $78.
Turning next to the observations from Black Book’s representatives stationed at nearly 60 sales nationwide, here is what an auction GM in Tennessee told the lane watcher.
“Our sales percentages have been in the low 60s which is good. The market hasn’t hit full stride yet, but I expect it to take off in the next couple of weeks,” the auction GM said.
The other tales from the lanes offered an array of what’s happening in the lanes, including:
— From Massachusetts: “For the second week in a row the money was subpar. One of the few bright spots was the midsize SUVs.”
— From New Jersey: “For the most part luxury cars and SUVs were selling for lower, even the units with low miles and strong CRs.”
— From Indiana: “The sale was much better than the weather, with compact cars and CUVs leading the way.”
— From Florida: “The market is steady here, with dealers looking for vehicles that have both good miles and good history.”
Update on the specialty markets
As they do at the beginning of each month, Black Book editors also relayed their latest observations of what’s happening within the specialty markets. Here is that rudown:
— Collectibles: Black Book indicated the final sales numbers from the collectible car auctions held in Arizona are in, and they’re “impressive.” Editors computed the total for roughly 10 days of sales was a little more than $250 million.
— Recreational Vehicles: “We are solidly into winter now, and brutally cold weather has gripped large parts of the country,” editors said. “Although the volume of vehicles offered at auction has dropped, as we’d expect for this time of year, the values of those that were sold actually increased a little bit for both towables and motorized units.”
— Powersports: Black Book indicated powersports values are still “frozen” in negative territory this month. “The changes in value we see for February are very similar to the changes from January,” editors added.
— Heavy Duty: Editors noted used trucks of all ages dropped more across all segments than last month but are “still doing very well.”
— Medium Duty: Black Book mentioned increased demand has helped offset price depreciation as a steady supply of used inventory continues through January.
To buy new or used? Consumers who are debating that issue might be surprised that, according to a study from iSeeCars.com, certain models can be more economical when purchased new.
The average new car costs 30.2 percent more than the 1-year-old used version of the same vehicle, according to the study, which analyzed more than 7 million new and used cars sold from August 2018 to January 2019, compared the prices of new cars to lightly used equivalents and identified those with the lowest price differences.
But the study notes that certain new cars have a price difference of as little as 10.5 percent, or less than $2,300.
“Instead of buying a car that’s already been driven for one year, consumers can buy the new version of select vehicles for just a few thousand dollars more to avoid the uncertainties that come with purchasing a used vehicle,” iSeeCars chief executive officer Phong Ly said in a news release. “When spread out over the average terms of a car loan about six years at a 4-percent interest rate, for example, the increased monthly payment can be as little as $35 per month. This price difference could even be less when you take into account new car incentives that may exist for a given model.”
The chart below from iSeeCars shows the 10 vehicles with the smallest percentage difference between the prices of new and used vehicles.
|
iSeeCars Top 10 Cars to Buy New Over Used
|
|
Rank (By Percentage)
|
Model
|
% Difference New Over Used
|
$ Difference New Over Used
|
|
1
|
Honda HR-V
|
10.5%
|
$2,260
|
|
2
|
BMW X1
|
11.7%
|
$4,194
|
|
3
|
Subaru Crosstrek
|
12.2%
|
$2,978
|
|
4
|
Honda CR-V
|
12.2%
|
$3,230
|
|
5
|
Toyota Tacoma
|
12.3%
|
$3,891
|
|
6
|
Honda Civic
|
12.3%
|
$2,505
|
|
7
|
Honda Pilot
|
12.8%
|
$4,518
|
|
8
|
Mazda CX-5
|
13.4%
|
$3,457
|
|
9
|
Porsche Macan
|
14.5%
|
$8,302
|
|
10
|
Subaru Impreza
|
14.7%
|
$3,035
|
|
Overall Average
|
|
30.2%
|
|
SUVs dominate the list of cars that have the smallest change in price between their new and gently used versions. Seven of the top 10 models in the list are SUVs, and subcompact SUVs make up the top three vehicles on the list.
“SUVs have eclipsed sedans as the most popular vehicle type, so it is no surprise that their surge in popularity has resulted in a below-average price difference between new and gently used versions,” explained Ly.
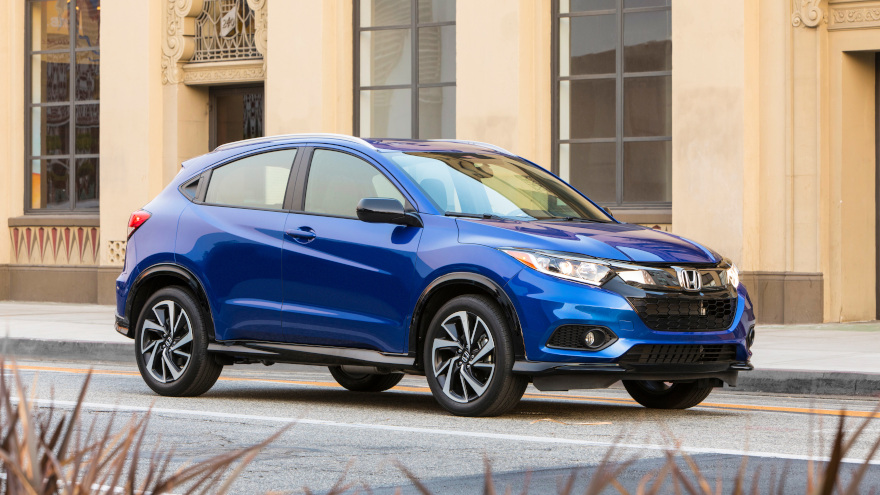
Among subcompact SUVs, the Honda HR-V takes the top spot with a 10.5-percent price difference. The second-ranked BMW X1 follows with an 11.7 percent difference, and the Subaru Crosstrek is next at 12.2 percent.
“Subcompacts are a rapidly growing segment because they strike the right balance of cargo room and other SUV perks while maintaining a price tag that is comparable to sedans,” said Ly. “Each are among the top models in their class, and the demand could be driving up prices for lightly used versions of these subcompact SUVs.”
The study also shows the popularity of small SUVs, with the list including the Honda CR-V at No. 4; the Mazda CX-5 at No. 8; and the Porsche Macan at No. 9.
“Both the CR-V and the CX-5 have high reliability and value ratings,” said Ly. “The lowest-cost model in the Porsche lineup, the Macan, was a Kelley Blue Book Resale Award winner in 2017 and 2018 and appeals to luxury buyers who want this desirable name badge.”
The Toyota Tacoma came in at No. 5, showing only a 12.3-percent price difference between new and used. “The Toyota Tacoma is known for its reliability and durability, and because of the high demand for lightly-used pickups, it maintains most of its value in the used car marketplace,” said Ly.
Only two passenger cars made the list, and they were compact sedans: the Honda Civic at No. 6 and the Subaru Impreza at No. 10.
“While the sedan segment as a whole is declining, this shows that there is still some demand for compact sedans,” said Ly. “The prices of compact cars rose in 2018 after years of declines due to rising gas prices and heightened demand from buyers looking for more affordable vehicles.”
The Honda Pilot midsize SUV came in at No. 7.
“The Honda Pilot is known for its reliability and is among the more affordable third-row SUVs available,” said Ly. “The demand is high for this practical and dependable family vehicle.”
In addition to the cars with the smallest price difference by percentage, iSeeCars determined the top 10 cars with the smallest difference between new and lightly used vehicles by dollar amount. The Honda HR-V came in at No. 1. The third-ranked Nissan Versa subcompact car, the seventh-ranked Nissan Rogue Sport subcompact SUV, the ninth-ranked Buick Encore subcompact SUV, and the 10th-ranked Chevrolet Cruze compact car were new to the list.
“Small cars and SUVs are priced lower than larger models, so there isn’t as much room for their price to come down from their new models,” Ly said.
Top SUVs to buy new over used
Drilling down further into the data set, iSeeCars determined the top 15 SUVs with the smallest price difference between their new and slightly used models.
Eight SUVs in varied sizes, including three midsize, three compact, and two subcompact, join the seven SUVs that made the aforementioned overall list.
|
iSeeCars Top SUVs to Buy New Over Used
|
|
Rank (By Percentage)
|
Model
|
% Difference New Over Used
|
$ Difference New Over Used
|
|
1
|
Honda HR-V
|
10.5%
|
$2,260
|
|
2
|
BMW X1
|
11.7%
|
$4,194
|
|
3
|
Subaru Crosstrek
|
12.2%
|
$2,978
|
|
4
|
Honda CR-V
|
12.2%
|
$3,230
|
|
5
|
Honda Pilot
|
12.8%
|
$4,518
|
|
6
|
Mazda CX-5
|
13.4%
|
$3,457
|
|
7
|
Porsche Macan
|
14.5%
|
$8,302
|
|
8
|
Nissan Rogue Sport
|
15.9%
|
$3,365
|
|
9
|
Subaru Forester
|
16.0%
|
$4,078
|
|
10
|
Chevrolet Traverse
|
17.0%
|
$5,906
|
|
11
|
Buick Encore
|
17.3%
|
$3,545
|
|
12
|
Toyota Highlander
|
17.5%
|
$6,044
|
|
13
|
GMC Terrain
|
18.4%
|
$4,951
|
|
14
|
Toyota 4Runner
|
19.1%
|
$6,614
|
|
15
|
Subaru Outback
|
19.6%
|
$5,543
|
|
SUV Average
|
21.5%
|
|
The Honda HR-V led the list. The three additional midsize SUVs, which join the Honda Pilot at No. 5, include the Chevrolet Traverse at No. 10, the Toyota Highlander at No. 12, and the Toyota 4Runner at No. 14.
“The Traverse and the Highlander are popular and reliable family crossovers that are competitively priced for the segment,” said Ly. “The 4Runner is built on a truck platform and is known for its ruggedness and durability, which could explain why a lightly used version maintains most of its value.”
The three additional compact SUVs are the ninth-ranked Subaru Forester, the 13th-ranked GMC Terrain, and the 15th-ranked Subaru Outback.
“Both the Subaru Forester and the GMC Terrain earn high reliability and safety ratings, which contributes to their high demand in the used-car marketplace,” said Ly. “Technically a crossover wagon, the Subaru Outback has a niche following of consumers who want a rugged crossover with the cargo space of an SUV that handles like a car.”
The eighth-ranked Nissan Rogue Sport and the 11th-ranked Buick Encore were the two subcompact SUVs.
“Nissan introduced the subcompact Rogue Sport in 2017 to capitalize on the success of the compact Rogue and appeal to consumers who want a sporty and spacious vehicle with car-like dimensions,” said Ly. “The Buick Encore is among the top vehicles in its class in terms of quality and popularity and has resonated with consumers by offering style and sophistication with an average new starting price of $24,077.”
Ly said full-size SUVs were noticeably absent from the list, with reasons including typically higher starting prices. They probably must drop quite a bit in price to attract used car buyers, he said.
Top pickup trucks to buy new over used
The iSeeCars analysis included the price differences between new and lightly used light-duty pickup trucks to determine the trucks with below average price differences when compared to the 24.4 percent segment average.
The Toyota Tacoma came in at No. 1. The Toyota Tundra, at No. 3, joins the No.1-ranked Tacoma as the second Toyota pickup to have a below-average price difference.
“Toyota pickups are known for being indestructible, which contribute to their value retention,” Ly said. “Additionally, Toyota is not a major fleet seller, so there are not as many in the used marketplace compared to fleet sellers like Ford, which heightens demand.”
The second-ranked Chevrolet Colorado and the sixth-ranked Chevrolet Silverado 1500A have a price difference below the 24.4 percent average for the segment.
“The Silverado 1500 is known for its technological features in addition to its durability, which help contribute to a lower-than-average price reduction on its one-year-old models,” Ly said.
The Nissan Frontier ranked fourth with a 17.2-percent price difference.
“A new Frontier has the lowest starting price of its competition at $27,307, and its ability to attract more practical pickup buyers has helped it steadily grow in popularity in recent years,” Ly said.
The Ford F-150 ranks fifth and rounds out the list of trucks that consumers should consider buying new instead of lightly used.
“The Ford F-150 is the top-selling pickup, which means that its high demand results in its high value retention,” said Ly. “The F-150 joins the Tundra as the only two full-size pickup trucks with a below-average price difference between their new and lightly-used models.”
Methodology
iSeeCars.com analyzed more than 7 million cars sold between August 2018 and January 2019. New cars included in the analysis were from model years 2018 and 2019. Lightly used cars were defined as used vehicles from model years 2017 and 2018.
Models with low sample size and cars with outlier mileages were not included in the analysis.
The complete study is available at https://www.iseecars.com/cars-to-buy-new-study
RVI Group examined the wholesale market in both the United States and Canada for the latest installment of the RVI Risk Outlook, spotting similar trends in both countries and comparable forecasts looking ahead toward 2020.
Beginning first in the U.S., report indicated December real used vehicle prices — seasonally adjusted for 2- to 5-year-old units — increased on a year-over-year basis. Analysts calculated that real used-vehicle prices (after adjusting for MSRP) increased by 3.5 percent in December 2018 when compared to December 2017.
On a month-over-month basis, RVI determined real used-vehicle prices decreased by 1.8 percent.
“Prices for used vehicles continue to be stronger as the economy continues to fuel consumer confidence with low unemployment and rising wages,” analysts said.
“The increasing supply of used vehicles and steady growth of incentive activity will continue to put downward pressure on used vehicle prices,” they continued. “We expect lease penetration to decline from record highs over the next three years. Thus, this supply of off-leased vehicles (record highs) will enter the market, and drive further declines in used vehicle prices.
RVI projected that used-vehicle prices are expected to decline by 3.4 percent from current levels by 2020.
“Key economic indicators signal a stable U.S. economy,” analysts said while pointing out that in the third quarter of 2018, GDP grew at an annual rate of 3.5 percent, down from 4.2 percent in the second quarter of 2018.
“The deceleration of the economy was caused by a decrease in personal consumption and exports,” analysts continued in the report.
Turning next to Canada, analysts found that real used vehicle prices in Canada also increased in December on a year-over-year basis.
RVI calculated the exchange rate decreased from November to December. The firm also noted Canadian GDP slowed in the third quarter of 2018, coming in at an annual rate of 2.0 percent, down from the 2.9 percent achieved in the second quarter of 2018.
RVI went on to mention new-vehicle sales increased slightly, with 2.1 million units (SAAR) sold in September 2018. On a year-over-year basis, real used vehicle prices increased by 8.0 percent in September.
“Looking ahead, we expect that a growing supply of off-lease vehicles in North America will put downward pressure on used vehicle prices, which are expected to decline by 6.1 percent from current levels by 2020,” analysts said.
Black Book is seeing a stable start to auction activity this month.
The newest Market Insights Report showed prices for both cars and trucks softened at the same rate last week as Black Book lane watchers shared observations that aligned with the data editors compiled.
Black Book reported that overall car segment values on a volume-weighted basis decreased by 0.44 percent last week. In comparison, the market values for these vehicles had decreased by 0.66 percent on average during the prior four-week period.
Among cars, editors noticed the sub-compact car and compact car segments experienced the smallest drops, ticking down by just $18 and $24, respectively.
Again volume-weighted, Black Book determined overall truck segment values (including pickups, SUVs and vans) also dropped by 0.44 percent last week. During the previous four-week span, the average decline for trucks came in at 0.59 percent.
In the truck space, editors found that sub-compact luxury crossovers sustained the biggest price drop, sliding by 1.5 percent or $250.
“Weekly depreciation dropped to the lowest level in nine weeks. The car segments and light truck segments registered similar depreciation rates last week,” said Anil Goyal, executive vice president of operations for Black Book.
Turning next to Black Book’s representatives stationed at nearly 60 sales nationwide, the anecdotes reflected a mix of lane intensity. Here is the rundown:
— From Pennsylvania: “The market here could best be characterized as steady. The really nice merchandise is bringing very good money.”
— From Georgia: “Passenger cars sold well, but the same could not be said for the SUVs.”
— From California: “There was active bidding in most of the lanes today. Cars, trucks and SUVs all sold well. For example, a 2016 pickup truck with 81,000 miles brought very strong money.”
— From Indiana: “Anything nice will sell. Consignment was down, and we had many more buyers than sellers.”
— From Nevada: “The high-line lanes were soft as two of the biggest consignors weren’t willing to lower floors to meet the bids.”
As the wholesale price experts from KAR Auction Services and J.D. Power Valuation Services saw December metrics move in similar different directions to close 2018, they also agree that prices are likely to dip somewhat as this year continues.
According to ADESA Analytical Services’ monthly analysis of wholesale used-vehicle prices by vehicle model class, prices in December averaged $10,620 — up a modest 0.2 percent compared to November and down 1.7 percent relative to December of 2017.
KAR Auction Services chief economist Tom Kontos explained that on average, truck prices softened more than car prices, which were up significantly versus November, though down year-over-year.
“Average wholesale prices in December fell on a year-over-year basis for the second month in a row and for the seventh time in 2018, supporting our expectation of general price softening due to supply growth,” he continued in his latest edition of the Kontos Kommentary.
“Supply growth is increasingly concentrated in the truck segments, which consequently saw greater price softening in December than did cars,” Kontos continued. “On a month-over-month basis, rising car prices more than offset declining truck prices, allowing a modest increase in overall wholesale prices.
“Auction prices for off-lease units were another major bright spot, as upstream remarketing continues to be effective in distributing supply across multiple channels,” he went on to say, while elaborating more in a video that’s available here.
Kontos also dissected wholesale price movements of midsize cars and midsize SUV/CUVs that are 3 years old with less than 45,000 miles. Typically characterized as off-lease units, he pointed out that prices were up significantly on a year-over-year basis for both categories when holding constant for sale type, model-year age, mileage and model class segment.
Prices for those particular cars rose $596 or 5.7 percent to $10,985, while prices for those specific utilities climbed $1,488 or 8.6 percent to $18,855 in December as compared to a year earlier.
Kontos wrapped up his last analysis of 2018 data by noting average wholesale prices for used vehicles remarketed by manufacturers declined 4.5 percent month-over-month and 4.0 percent year-over-year.
He determined December prices for fleet/lease consignors edged 0.4 percent lower sequentially but ticked up 6.2 percent annually.
Furthermore, Kontos added that average prices for dealer consignors in December were down 0.4 percent versus November and down 2.2 percent relative to the same month in 2017.
Analysis from J.D. Power Valuation Services
Meanwhile the team at J.D. Power Valuation Services shared their December wholesale price data, too, noting a decline for the fourth consecutive month to close 2018, what analysts described as a “typical” result.
Contained in the most recent edition of Guidelines, the J.D. Power Valuation Services’ Seasonally Adjusted Used Vehicle Price Index declined by 0.4 points in December on a sequential basis to land at 119.6. Despite the downward streak to close the year, analysts pointed out the index reading finished at the highest point since 2016.
All told in 2018, J.D. Power Valuation Services calculated wholesale prices rose 2.9 percent compared to 2017 information; a “healthy” gain driven by what analysts noted as the mainstream portion of the market.
Analysts determined prices for compact cars finished 2018 about 9 percent higher than the prior year while prices for midsize cars climbed by 7 percent.
An increase in supply kept prices for utilities from climbing at the same rates, but J.D. Power Valuation Services found they still rose year-over-year. Prices for compact SUVs finished 2018 with a 2-percent increase, and midsize utility prices rose nearly 5 percent, according to information shared via Guidelines.
On the premium side of the market, analysts noticed widespread price declines with the midsize car segment sustaining price declines that stretch all the way to 2012. That segment saw a downward price move of 7 percent in 2018.
So what’s ahead in 2019?
J.D. Valuation Services projected that wholesale prices are expected to “cool off” this year with an annual decline predicted to come in at about 1.1 percent.
“There should be increased in used supply once again this year along with more volatile credit conditions, which are expected to apply downward pressure on the used side of the market,” analysts said in their report.
“Gasoline prices and labor conditions are expected to have neutral impacts, while overall demand and consumers’ appetite for used cars, which is supported by increases in equipment as well as more advanced safety and technology features, will help to balance out but not outweigh the anticipated negatives for the year,” analysts went on to say.
ADESA Wholesale Used-Vehicle Price Trends
| |
Average |
Price |
($/Unit) |
Latest |
Month Versus |
| |
December 2018 |
November 2018 |
December 2017 |
Prior Month |
Prior Year |
| |
|
|
|
|
|
| Total All Vehicles |
$10,620 |
$10,599 |
$10,804 |
0.2% |
-1.7% |
| |
|
|
|
|
|
| Total Cars |
$8,337 |
$8,197 |
$8,502 |
1.7% |
-1.9% |
| Compact Car |
$6,398 |
$6,315 |
$6,452 |
1.3% |
-0.8% |
| Midsize Car |
$7,252 |
$7,149 |
$7,651 |
1.4% |
-5.2% |
| Full-size Car |
$8,071 |
$7,822 |
$7,551 |
3.2% |
6.9% |
| Luxury Car |
$12,786 |
$12,516 |
$12,959 |
2.2% |
-1.3% |
| Sporty Car |
$13,034 |
$13,143 |
$13,846 |
-0.8% |
-5.9% |
| |
|
|
|
|
|
| Total Trucks |
$12,595 |
$12,635 |
$12,966 |
-0.3% |
-2.9% |
| Minivan |
$8,306 |
$8,141 |
$8,891 |
2.0% |
-6.6% |
| Full-size Van |
$11,122 |
$11,583 |
$12,619 |
-4.0% |
-11.9% |
| Compact SUV/CUV |
$10,991 |
$10,890 |
$10,508 |
0.9% |
4.6% |
| Midsize SUV/CUV |
$10,980 |
$10,982 |
$11,148 |
0.0% |
-1.5% |
| Full-size SUV/CUV |
$13,306 |
$14,070 |
$14,856 |
-5.4% |
-10.4% |
| Luxury SUV/CUV |
$17,686 |
$17,463 |
$18,711 |
1.3% |
-5.5% |
| Compact Pickup |
$9,464 |
$9,600 |
$9,209 |
-1.4% |
2.8% |
| Full-size Pickup |
$15,351 |
$15,540 |
$16,189 |
-1.2% |
-5.2% |
Source: ADESA Analytical Services.
It’s a potential clash that can lead to frustration for both potential buyers and dealerships — haggling over what a trade might be worth.
According to a recent survey conducted by Black Book, consumers believe a vehicle trade-in quote that’s far from expectations remains the second-most likely reason to kill a deal. Editors acknowledged the trade-in process remains largely inefficient, which is why Black Book and The Appraisal Lane have teamed up to give consumers what the company say is an enhanced trade-in experience while improving dealer efficiencies.
The Appraisal Lane launched a mobile app — accessible from dealer websites and the app store — providing consumers with cash offers for their trades, in minutes, from a live team of experts. With this new platform, consumers can start their research with Black Book’s precision-based values to get the most market-reflective price range for their used vehicle.
When ready to transact, individuals can connect in real-time with The Appraisal Lane by answering simple condition questions, uploading photos of their vehicle and getting a guaranteed offer. The offer is redeemable at a participating dealer as money toward the purchase of a replacement vehicle, or as cash in hand.
The Appraisal Lane team utilizes Black Book valuation data in conjunction with market insights and deep appraisal knowledge across all makes and models to assess each used vehicle on its own merit and provides consumers with the best possible cash offer.
Real time communication between consumers and a live team of appraisers can give consumers the confidence and transparency that they have been missing in current online vehicle valuation processes.
“Black Book and The Appraisal Lane share the same fundamentals of combining data science with human touch to most accurately determine a vehicle’s value,” said Jared Kalfus, executive vice president of revenue for Black Book.
“Our values, coupled with The Appraisal Lane’s live cash offers, effectively put the dealership trade-in process right in the palm of a consumer’s hand,” Kalfus continued. “Dealers that offer this experience are poised to improve customer engagement, increase business, and stand apart from the competition.”
Jeff Risner, a 30-year auto industry veteran, and co-founder and chief executive officer of The Appraisal Lane, says the launch his company’s consumer app was designed to improve a process that has been largely underserved by technology.
“There are two universal truths in our industry,” Risner said. “Every used car is as unique as the person driving it, and a used car is only worth what someone is willing to pay for it, at any given time. These truths involve human interaction — a live appraisal and a cash offer from experts who incorporate quality vehicle values in their toolset.
“When you use technology to connect with consumers in real-time and make them a fundamental part of the process, you provide an exceptional trade-in experience and create a much deeper level of engagement before they visit the dealership,” Risner continued.
Dealers currently use The Appraisal Lane’s industry products to manage, move, and source inventory and are now utilizing the company’s consumer app to streamline the trade-in process, improve customer satisfaction and make more retail deals.
Launched a little more than three years ago, The Appraisal Lane community consists of more than 1,000 members and is growing.
Black Book pinpointed the reason why it’s been a brisk start to 2019 in the lanes.
Reinforced by the assessment of an auction general manager in the Southeast, Black Book executive vice president of operations Anil Goyal described the current wholesale market situation in the latest Market Insights report released on Tuesday.
“Lower floors at the start of the new year have kept the inventory moving faster,” Goyal said. “We are seeing higher sales rates, but lower prices at the auctions.”
And Black Book’s sale observer stationed in North Carolina shared this anecdote from the auction GM: “Our business has been really good as our sales percentages are between 60 and 70 percent. We are anticipating a continuance of this solid market through the winter and spring at least.”
Editors then shared the latest data, beginning with cars.
Volume-weighted, Black Book reported overall car segment values decreased by 0.74 percent last week. In comparison, market values for these had decreased by 0.64 percent on average during the prior four-week period.
Among cars, editors pointed out the luxury car and sporty car segments experienced the biggest drops, each sliding by 0.91 percent.
Again volume-weighted, Black Book determined overall truck segment values (including pickups, SUVs and vans) softened by 0.75 percent last week. That’s a notable jump from the average editors noticed during the past four weeks, which was 0.53 percent.
Within trucks, editors found that sub-compact crossovers sustained the greatest price decline, dropping by 1.65 percent.
To wrap up the latest report, Black Book representatives described activity in the lanes from two other places.
From Georgia: “Floors were down regardless of vehicle condition or model year, so the buyers felt they were paying fair prices for vehicles.”
From Pennsylvania: “Volume was up as was the dealer attendance both physically and online. The less expensive vehicles were bringing good money.”
Black Book’s latest wholesale observations — both its Used Vehicle Retention Index for December as well as its Market Insights report recapping the opening week of 2019 — highlighted softening prices, reinforcing what one auction told editors that tax season might be “more of a myth than a reality.”
Beginning first with the December Used Vehicle Retention Index, Black Book reported the reading came in at 116.3, dipping slightly from the previous month’s mark of 116.5. December showed the first decline in the index dating back to May.
Editors noted that the Used Vehicle Retention Index finished the year up by 1.9 percent compared with 2017. It was the largest year-over-year increase for the Index dating back to 2012, when the index climbed 3.5 percent compared with 2011.
Black Book peeled out notable gains and losses in retention from its latest index analysis, including:
Gains
• Midsize car: up 0.55 percent
• Midsize luxury CUV/SUV: up 0.31 percent
• Compact luxury CUV/SUV: up 0.29 percent
Losses
• Minivan: down 1.6 percent
• Full-size luxury CUV/SUV: down 1.54 percent
• Full-size van: down 1.3 percent
• Midsize crossover/SUV: down 1.14 percent
• Premium sporty car: down 1.02 percent
“The segments showing the greatest gains and declines in the Index this month were a mix of car and truck segments,” said Anil Goyal, Black Book’s executive vice president of operations. “This is certainly the time of year when we see declines ahead of the spring selling season.
“However, the decline in December was higher than typical seasonality, thus a slight decline in the index,” Goyal continued. “Given the current economic conditions, demand for used and new vehicles remains strong but there is a cloud of uncertainty as we start 2019.”
The Black Book Used Vehicle Retention Index is calculated using Black Book’s published wholesale average value on 2- to 6-year-old used vehicles, as percent of original typically-equipped MSRP. It is weighted based on registration volume and adjusted for seasonality, vehicle age, mileage and condition.
The index dates to January 2005 when Black Book published a benchmark index value of 100.0. During 2008, the index dropped by 14.1 percent while during 2016, the index fell by just 6.4 percent.
During 2011, the index rose strongly from 113.3 to 123.0 by the end of the year as the economy picked up steam and used vehicle values rose higher. It continued to remain relatively stable, rising slightly until May of 2014 when it hit a peak of 128.1.
To obtain a copy of the latest Black Book Wholesale Value Index, go to this website.
Activity during first week of 2019
Black Book’s Market Insights report showed the prices of cars declining more than trucks to begin 2019.
“In the first week of the new year, values of used vehicles continued to decline on pace with the trend seen in December. The previous year ended with the lowest depreciation rate in three years,” Goyal said.
Volume-weighted, editors noticed that overall car segment values decreased by 0.69 percent last week. In comparison, the market values softened by 0.64 percent on average during the prior four-week period.
Among the car segments, Black Book mentioned the full-size car (down 1.10 percent), sub-compact car (down 1.12 percent), and luxury car (down 0.95 percent) segments experienced the biggest price drops.
Again volume-weighted, editors determined overall truck segment values (including pickups, SUVs, and vans) dipped by 0.54 percent last week. That’s nearly on par with the previous four week as the market values for these units dipped by 0.55 percent on average.
And in the truck segment, Black Book reported that the sub-compact luxury crossover (down 1.10 percent) and full-size luxury crossover/SUV (down 0.80 percent) segments performed the worst.
Black Book's report also included anecdotes editors collected from the lanes. The first one came from an auction owner in Pacific Northwest.
“Cautious optimism is the theme for me. I believe things will ramp up a bit right away, while slowly gaining momentum. 2019 will be better than last year for used vehicles. The ‘tax season’ feeding frenzy is now more of a myth than a reality,” the owner told Black Book.
Editors shared the views from a wholesale buyer in Texas, as well.
“Bought several vehicles online and the floors have definitely been adjusted,” the buyer told Black Book. “On some $40,000 vehicles they were down close to $1,000 from the mid-December floors. I buy for several new-car stores and I can tell you that retail is flat here in the Southwest. I am buying mostly trucks and SUVs as the low fuel prices have kept them hot.”
Update on the specialty markets
And as they do at the top of each month, Black Book editors describe conditions within the specialty spaces. Here is their rundown:
— Collectibles: Although most enthusiasts are anxiously awaiting the collectible car “super week” that happens in Scottsdale, Ariz., this month, Black Book insisted that observers shouldn’t forget that Mecum is hosting a major auction in Kissimmee, Fla., through Jan. 13.
— Recreational Vehicles: As we move further into winter, Black Book indicated RVs are continuing to exhibit typical seasonal behavior. “Both towables and motorized units are down slightly this month, but their rate of decline has slowed,” editors added.
— Powersports: Black Book noted that the Powersports market is down as we enter 2019. “Nearly all segments see declines in value, with the off-road bikes taking the biggest hit this month,” editors said.
— Heavy duty: Editors indicated: “Trucks are moving in and out of service faster and we will be watching to see how much wholesale values are affected.”
— Medium duty: Black Book closed discussion in this space by stating wholesale prices continue to stabilize as demand grows for units in these segments to satisfy regional delivery and construction needs.
It’s the midst of winter and the analysts at J.D. Power Valuation Services are still seeing the impacts of what happened in the wholesale market during the summertime.
The December installment of Guidelines included the forecast of how wholesale prices would land for 2018. Analysts explained that because of the “exceptionally strong performances observed over the summer months” that they projected wholesale prices would come in 3 percent higher at the close of 2018 compared to the end of the previous year.
While just a couple of days into 2019, J.D. Power Valuation Services thinks that wholesale prices will soften by 1.2 percent when the year finishes.
This edition of Guidelines also included the latest reading of J.D. Power Valuation Services’ Seasonally Adjusted Used Vehicle Price Index. The November figure declined by 0.8 points compared to October to settle at 119.7. The slight tick lower still kept the reading at its highest level since early 2016 and 3.6 points above the mark registered in November 2017.
Looking deeper into the data, analysts found that passenger cars kept prices robust on the mainstream side of the market.
J.D. Power Valuation Services projected that compact-car prices would finish 2018 at a point 9 percent higher than 12 months earlier. Analysts pegged the expected price jump for midsize cars at 7 percent.
While still rising, analysts contend that compact utility prices would come in 2 percent higher at the close of 2018 compared to a year earlier. And J.D. Power Valuation Services sees midsize utility prices finishing 2018 at about 5 percent above the same point.
Analysts explained in the report why car prices are rising more than utilities.
“Mainstream SUV prices are also expected to increase, however not nearly to the same level as their car counterparts,” analysts said. “There are a few reasons for this. One of the primary drivers is the increase in used supply of these segments along with affordability, which favors more competitively prices passenger cars.”
On the premium side of the wholesale space, J.D. Power Valuation Services indicated a much different story is unfolding.
“Prices are expected for be down for most segments, with some of the worst losses expected in the luxury midsize car segment, which has seen steady year-over-year declines since 2012,” said analysts, who are thinking prices for these units could soften by 7 percent at the close of 2018.
KAR Auction Services chief economist Tom Kontos easily explained the notable wholesale price decline he and his analyst team spotted after compiling November data.
According to ADESA Analytical Services’ monthly analysis of wholesale used vehicle prices by vehicle model class, Kontos noted wholesale used-vehicle prices in November averaged $10,599 – down 4.2 percent compared to October and down 1.8 percent relative to November of last year.
“Average wholesale prices in November softened on a year-over-year basis in part from comparison to last year’s inflated prices from Hurricanes Harvey and Irma,” Kontos said in his latest edition of the Kontos Kommentary that arrived on Friday afternoon.
“Still, prices were down on a month-over-month basis in November at a greater-than-seasonal level, indicating weaker market conditions,” he continued. "Off-lease units remain a major bright spot, as these vehicles are scarcer at physical auctions, despite growth in lease terminations, because more of these units are being purchased upstream.
“As a group, the truck segments held up somewhat better than the car segments, but virtually all model classes showed declines,” added Kontos, who elaborated about the latest trends in this video.
When holding constant for sale type, model-year age, mileage, and model class segment — using criteria that characterize off-lease units — Kontos also pointed out that prices were up significantly on a year-over-year basis for both midsize cars and midsize SUV/CUVs when he examined specific units at 3-years-old and less than 45,000 miles.
Wholesale prices for those specific cars climbed $652 or 6.1 percent to $11,308 while wholesale prices for those particular SUV/CUVs spiked $1,734 or 9.8 percent to $19,374.
Looking elsewhere at November activity in the wholesale space, Kontos mentioned average prices for used vehicles remarketed by manufacturers softened 3.0 percent month-over-month and 2.8 percent year-over-year.
He added that prices for fleet/lease consignors declined 3.8 percent sequentially rose 4.6 percent annually.
Kontos also noted average prices in November for dealer consignors slid 3.7 percent versus October and 1.9 percent relative to November of last year.
Based on data from the National Automobile Dealers Association, Kontos wrapped up his latest analysis by highlighting retail used-vehicle sales by franchised dealers rose 2.2 percent year-over-year in November, but ticked 0.9 percent lower for independent dealers.
Kontos also said November certified pre-owned sales dropped 3.3 percent compared to the prior month but increased 1.8 percent year-over-year, according to figures from Autodata Corp. On a year-to-date basis, he mentioned CPO sales remain up 2.2 percent versus last year.
ADESA Wholesale Used-Vehicle Price Trends
| |
Average |
Price |
($/Unit) |
Latest |
Month Versus |
| |
November 2018 |
October 2018 |
October 2017 |
Prior Month |
Prior Year |
| |
|
|
|
|
|
| Total All Vehicles |
$10,599 |
$11,059 |
$10,797 |
-4.2% |
-1.8% |
| |
|
|
|
|
|
| Total Cars |
$8,197 |
$8,672 |
$8,546 |
-5.5% |
-4.1% |
| Compact Car |
$6,315 |
$6,586 |
$6,565 |
-4.1% |
-3.8% |
| Midsize Car |
$7,149 |
$7,565 |
$7,794 |
-5.5% |
-8.3% |
| Full-size Car |
$7,822 |
$7,874 |
$7,190 |
-0.7% |
8.8% |
| Luxury Car |
$12,516 |
$13,311 |
$13,223 |
-6.0% |
-5.3% |
| Sporty Car |
$13,143 |
$14,315 |
$13,739 |
-8.2% |
-4.3% |
| |
|
|
|
|
|
| Total Trucks |
$12,635 |
$13,079 |
$12,950 |
-3.4% |
-2.4% |
| Minivan |
$8,141 |
$8,660 |
$8,554 |
-6.0% |
-4.8% |
| Full-size Van |
$11,583 |
$12,547 |
$12,940 |
-7.7% |
-10.5% |
| Compact SUV/CUV |
$10,890 |
$11,025 |
$10,599 |
-1.2% |
2.7% |
| Midsize SUV/CUV |
$10,982 |
$11,551 |
$11,133 |
-4.9% |
-1.4% |
| Full-size SUV/CUV |
$14,070 |
$14,061 |
$14,208 |
0.1% |
-1.0% |
| Luxury SUV/CUV |
$17,463 |
$18,218 |
$18,844 |
-4.1% |
-7.3% |
| Compact Pickup |
$9,600 |
$10,046 |
$9,102 |
-4.4% |
5.5% |
| Full-size Pickup |
$15,540 |
$16,224 |
$16,419 |
-4.2% |
-5.4% |
Source: ADESA Analytical Services.