Along with discussing two elements impacting the revenue stream at Insurance Auto Auctions as well as more auction locations that might become part of the company, KAR Auction Services chief executive officer Jim Hallett said the company is seeing volume growth both in the physical lanes as well as its online-only channels.
What especially impressed investment analysts was how ADESA reported a 14-percent volume in the second quarter as Wall Street observers noticed the industry-wide improvement came in at about 9 percent.
“I’d say that we look at those numbers with a little bit of caution. We were at 14 percent and the industry did report 9 percent,” Hallett said when KAR hosted a conference call to discuss its Q2 performance.
“But we really don't put a lot of credence in those numbers until we get a year-end result and we get a full report,” he continued. “But with that said, our commercial business is very strong. And all segments are doing well. And that’s right in our kitchen.”
Also cooking nicely in KAR’s wholesale kitchen is dealer consignment. Hallett described it as a “phenomenal job” that the company as a whole generated a 7-percent lift in dealer consignment in Q2.
“Many of you go back in history with me to where in 2009 our dealer consignment business was at 25 percent of our total business,” Hallett said. “And we knew with the headwinds that we were going to face on the commercial side that we had to get a lot better with dealer consignment.
“This is probably one of the initiatives that I’m most proud of is the fact that we’ve been able to take that dealer consignment up to 50 percent of our business and not just take it up, but to hold it there,” he continued.
Not only is KAR seeing a steady flow of dealer consignment volume, the company is also witnessing its lanes filling with units from other segments of the wholesale market, too, trends that Hallett is expecting to see continuing for the foreseeable future.
“Our customers have told us that off-lease supplies in the second half of 2015 will be stronger than what they were in the first half of the year,” Hallett said. “And the number of cars selling online only is growing, but not as fast as the supply of off-lease vehicles. The good news is this is driving strong physical auction volumes.
“We knew that volume was going to increase, but I think the pleasant surprise was all segments were really improving,” he continued. “When you think about, we often just focus on the fleet, lease and repo, obviously this is heavily driven by the fleet lease and repo segments. But you know what, we’ve seen a large increase in factory cars. We’ve seen an increase in daily rental cars.”
Expanding footprint
KAR is still on the hunt for more locations even though another site near Pittsburgh is already in its portfolio and a green field is coming together in the Chicago market.
“We’re still very much a believer in brick-and-mortar auctions,” Hallett said. “We believe that not only does it give you a physical site that allows you to also grow your ancillary services and your revenues, but it also gives you another customer base that grows the customer base, and contributes to the online customer buying base as well.”
Hallett then reiterated that KAR remains interested in acquiring more independent auctions and bring them into the company umbrella.
“We did identify there’s probably five to 10 of them, as you mentioned, in the country. I didn't say we're going to get all five or 10 of them done anytime soon,” Hallett said. “But we are always in communication with the independents. We have good relationships with the independents, and I think you'll see us complete Chicago, and I think you can expect that we would be opportunistic as more of these opportunities become available.
“You would see us act on specific ones if they contribute to the geography and the customer mix and the strategy that we're looking to build on overall,” he went on to say.
KAR chief financial officer executive vice president Eric Loughmiller then interjected that the company would “be disciplined on how we value the businesses as well.
“That’s part of what drags these things out is we're very disciplined on how we value the physical auction businesses,” Loughmiller added.
Factors influencing IAA’s revenue
Insurance Auto Auctions generated an 11-percent revenue increase during the second quarter. Perhaps the jump might have been higher, but Hallett indicated that “commodity prices have continued to be depressed, impacting the lowest value vehicles sold there, and therefore affecting our buy fees.”
Loughmiller explained how the company examined the situation further to prepare for its Q2 report. He examined selling prices for salvaged vehicles in the second quarter and compared them to a year earlier.
“I found it interesting that we sold more than two times the number of cars in Q2 2015 than Q2 2014 at a value of $300 or less,” Loughmiller said. “This clearly demonstrates the impact commodity prices are having on the value of salvaged vehicles, especially the lowest value vehicles.”
Beyond commodity prices, another investment analyst wondered if IAA is seeing insurers put additional pressure on the company to keep costs low as vehicle accidents rise, perhaps impacting KAR’s ability to generate more profit by this division.
“Really the pressure comes from service-level agreements that are embedded in these insurance contracts,” Loughmiller said. “The pressure I would describe as we're expected to pick up the cars faster. It helps to reduce the cost of storage and things that the insurance company might be incurring prior to it getting to the salvage yard. Again, the model works very well for us and I'd say the pressure is really focused on the tow cost.”
In the latest installment of the annual Power 300 issue of Auto Remarketing, we launched a new feature to spotlight just a few of the companies on the list. In a Q&A format, we go behind the scenes with some of the leading companies in the used-car space.
Next up in this series is Larry Dixon, senior manager of market intelligence, NADA Used Car Guide
Auto Remarketing: Looking out over the summer months, what is NADA UCG’s prediction for depreciation? Will rates differ from seasonal norms at all, and what kind of pricing can dealers expect in the lanes?
Larry Dixon: We expect the pattern of depreciation to follow a typical path for the remainder of the year – usually we’ll see depreciation improve a bit June and July, increase between September and October, and then lessen again over the last two months of the year.
Last year was something of an anomaly in that depreciation through the heart of the summer was unusually steep, with prices of vehicles up to 8 years old falling by roughly 3 percent on a monthly basis in July and August. For context, depreciation for the pair has been closer to 2 percent over the past 10 years (excluding 2008–2009).
For 2015, we anticipate depreciation will move back toward the historical average. As for September and October, we expect prices to fall by about 3 percent per month — which is in line with what we observed last year. Depreciation in November and December is forecast to be in the 1 percent to 2 percent range — or a bit steeper than in 2014.
All told, we expect depreciation to reach 14 percent for the full calendar year, which is slightly worse than 2014’s rate of 13 percent. That being said, 14 percent is strong by historical standards. We foresee much steeper declines in 2016 and 2017.
AR: Let’s take a look at the used supply environment. Does NADA UCG expect any significant increase in supply over the course of the second half of the year?
LD: The rate of supply growth should be fairly steady moving forward through the second half of the year. NADA Used Car Guide’s used-vehicle supply forecast shows overall late-model supply (vehicles up to 5 years old) rising by 4 percent in the second half of the year and off-lease volume increasing by a more significant 9 percent. These figures are similar to our estimates for the first half of the year. Rising new-vehicle sales and lease penetration will keep volume on the rise for years to come.
AR: Are any segments, in particular, seeing supply expand more rapidly? If so, why?
LD: Supply growth has been greatest for subcompact cars and compact and midsize utilities (both non-luxury and luxury). Growth is a reflection of both new-sales growth and a rise in lease penetration. For example, not only have new compact utility sales grown by an incredible 72 percent since 2010 (new sales overall are up by roughly 41 percent), but lease penetration has moved from 16 percent to 25 percent as well. Combined, these factors increase used supply at a faster rate.
AR: What segments are performing the strongest as far as price retention goes, and why?
LD: Midsize and large pickups are doing exceptionally well right now. In fact, they’ve been the strongest performing segments for quite some time. Retention for 3-year-old midsize and large pickups stands at 64 percent and 60 percent, respectively. For context, average retention for all 3-year-old models is 52 percent. Retention for the two pickup segments has declined by just 2 percentage points since the end of 2014.
High new-vehicle prices, relatively low supply — pickup owners tend to hold onto their vehicles longer, therefore it takes more time for them to return to the market — and lower gasoline prices all support pickup demand and as such retention.
Other strong performing segments include compact, midsize and large utilities. Three-year retention for the group averages 56 percent. Highly versatile and more fuel-efficient than in the past, used demand for utilities mirrors the strength we’ve witnessed on the new side of the market.
Other features in this special section:
4 questions with NextGear’s Brian Geitner
Light vehicles in operation, as of January 1, reached a record level of 257.9 million. And the average age of those vehicles experienced a slight uptick to 11.5 years old. On top of that, volumes of cars up to five years old are expected to jump by as much as 24 percent over the next five years.
That’s according to data from IHS Automotive, who noted that the number of registered light vehicles increased by more than 5.3 million since last year, a 2.1-percent jump representing the highest annual increase the U.S. automotive industry has seen since IHS began tracking the metric.
IHS predicts that the average age of light vehicles in the U.S. will likely climb again in 2016 and hit 11.6 years, but there is a plateau expected. It will likely take until 2018 for the average age to hit 11.7 years in 2018. This slowdown in growth is predicted due to the recent recovery of new-vehicle sales.
Another interesting angle to look at the overall American fleet is the age mix. IHS anticipates, based on the aforementioned new-vehicle registration growth, that the volume of vehicles ages zero to 5 years old will increase by 24 percent over the next five years. Vehicles in the 6- to 11-year-old range will decline by 11 percent while vehicles 12 years and older will continue to grow, by as much as 15 percent, by 2020.
“While the decline in volumes of vehicles six to 11 years old appears to indicate that the aftermarket ‘sweet spot’ — those model years driving the majority of aftermarket repair opportunities — is shrinking,” Seng said. “I believe we need to begin thinking about that ‘sweet spot’ differently. Now that the average age is 11.5 years, the key to repair opportunities must include vehicles older than 11 years, which hasn’t been considered by many in the marketplace up to now.”
As of this year, the number of 6- to 11-year-old vehicles in the U.S. consists of 81 million cars and light trucks. Extending that range to include up to 13-year-old vehicles, that number jumps to 108 million and borders 120 million for vehicles between 6 and 14 years of age.
“As long as we have tracked average age, it has gradually risen over time due to the increasing quality of automobiles,” said Mark Seng, IHS Automotive’s global aftermarket practice leader. “For the five to six years following the recession, however, average age increased about five times its traditional rate, which we attribute to the nearly 40 percent drop in new-vehicle sales in 2008-2009. We’re now seeing average age begin to plateau and return to its traditional rate of increase as consumers have recovered from the great recession and have begun buying new vehicles again.”
Looking at some of this year's vehicles passing through the auction lanes, the National Auto Auction Association’s most recent Economic Dashboard indicates that monthly auction volume at the end of June was up 8.3 percent over June 2014, and year-to-date numbers were up 7.3 percent, both for comparable weeks.
Here are a few other interesting stats fleshed out by IHS:
- New vehicle registrations outpaces scrappage by over 42 percent, the highest rate since the stat has been tracked by the IHS.
- As of Q1 2015, the average length of ownership for a new vehicle is 77.8 months, an increase of nearly 26 months since Q1. 2006. Following the same metric, used vehicle ownership averages out to 63 months, an increase of 25 months since Q1.
- The number of vehicles scrapped in 2014 declined from 2013’s number to just over 11 million light vehicles, representing 4.4 percent of the fleet. The record high number of vehicles scrapped in a year, 14 million vehicles, occurred in 2012.
For more insight from IHS Automotive, visit its site here.
Last month, some of the sportier Subaru models were proving hard to find, but in June, dealers may have been hard pressed to locate a number of Audi’s niche popular models for customers.
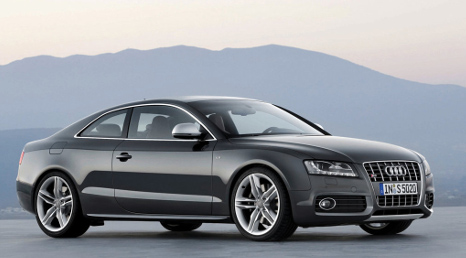
According to Autotrader’s June scarcity report, which lists certified pre-owned and used vehicles in high demand and low supply nationally as well as in specific regions, Audi’s performance-oriented S models and the A5 showed up frequently on this past month’s lists.
Sporty cars have been gaining steam among consumers for the better part of this year, Autotrader analysts pointed out.
“Since the start of spring, sporty cars generally have been in the highest demand and lowest supply partly because of the season,” said Michelle Krebs, senior analyst at Autotrader. “However, economic factors, notably higher employment, lower gas prices and an improved wealth factor from a healthy stock market and higher housing prices, apparently have made shoppers more comfortable considering a discretionary purchase like a sporty car.”
The CPO version of the Audi S4, the performance sedan based on the A4, was particularly scarce in June.
This model ranked No. 2 on the national scarcity list and No. 1 in the Atlanta, Philadelphia, Dallas-Fort Worth and San Francisco-Oakland-San Jose markets.
The CPO Audi S4 was also No. 2 in Los Angeles, No. 3 in New York and No. 4 in Boston on the regional scarcity lists.
The CPO model of the Audi S5 performance coupe also made a showing on the national scarcity list, coming in at No.7. The CPO model was also hard to find in a variety of market areas: No. 1 in Chicago; No. 3 in San Francisco-Oakland-San Jose; No. 4 in New York; and No. 7 in Los Angeles and Atlanta.
The CPO A5 came in at No. 1 on the Washington D.C. scarcity report, and the Audi A6 made an appearance, as well.
Breaking down the supply and demand situation for many of these Audi models, Krebs explained we have to look at the numbers.
“On the supply side, the S4, S5 and A5 are low-volume models as new cars so the total number of vehicles in operation for these models is small compared with other Audi models and vehicles from large-volume manufacturers,” said Krebs. “They represent an even smaller percentage of Audi’s certified pre-owned and used inventory.”
And supply is definitely lagging demand.
Audi continues to become and even more popular luxury brand, “posting dramatic growth on the new-car side for several years,” said Krebs.
Krebs also explained that one demographic, in particular, may be turning toward the Audi brand.
“In addition, Autotrader studies show Audi is an aspirational brand particularly with millennials, who may be looking at certified pre-owned and used as a way to acquire their dream brand,” Krebs said.
Subaru’s sportier models also peppered the scarcity lists, as well, after dominating many of the slots in May.
For example, the CPO Subaru WRX was the No. 1 scarcest vehicle last month, and the unit came in at No. 7 nationally on the late-model used list.
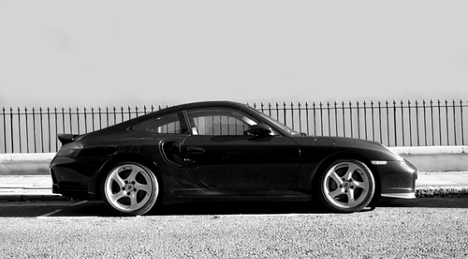
Other sporty models that remained scarce in June were a number of Porsche models, the Chevrolet Corvette and the Nissan 370z.
Krebs also pointed out one fluctuation that may be a sign fall is approaching.
“Extremely popular on the new-car side, sport utilities, a category that dominated the scarcity lists during the fall and winter months, also showed up more frequently on the June scarcity list — perhaps a harbinger of a change in the season,” Krebs said.
For example, the CPO Toyota 4Runner was the No. 4 most scarce vehicle in Atlanta last month; the used GMC Yukon came in at the No. 9 spot on the used list in Boston; and the CPO Jeep Wrangler notched the No. 3 spot in Dallas Ft-Worth, among others.
Click below for the full June CPO and late-model used scarcity lists, provided by Autotrader.

As used prices fell 2.5 percent last month, auction volume was on the way up, perhaps playing a role in the continuing depreciation being seen in the auction lanes.
According to the latest Guidelines report from NADA Used Car Guide, auction volumes of used cars up to 8 years old reached almost 317,000 units in June, which is up 1 percent from May’s total.
The increase spiked year-to-date volume up to a total of 2.07 million units, which according to NADA UCG data is up 7 percent from the same period of 2014.
And according to the latest Economic Dashboard prepared by NAAA chief economist Ira Silver, June’s high represented an 8.3-percent year-over-year climb in auction value, coming in as the largest year-over-year gain in auction volume for any month since January, when volume jumped 10.7 percent.
Taking a look at June’s auction volume statistics cited in the Guidelines report, NADA Used Car Guide explained the “on-going sell down” of rental programs contributed to a 9-percent drop in 2014 model-year volume last month. In June, volume for last year’s models came in at 51,600 units for a 26-percent drop from the 70,000 units pinnacle that was reached this past March.
On the other hand, volume for the 2015 model-year vehicles continued to ramp up considerable, rising by a whopping 44 percent from May to a total of 17,400 units.
As for the 2012 and 2013 model years, volume stayed relatively consistent at 59,000 and 58,000 units, respectively.
Lastly, NADA UCG pointed out a trend that is likely a reflection of a spike in trade-ins stemming from May’s strong new sales results.
Auction volume for 2007-2010 model years was up for the first time since March last month, increasing by an average of 2 percent to a total of 106,000.
Auction volume was up more than 8 percent year-over-year in June, and year-to-date figures continued to hold strong, according to the latest Economic Dashboard from the National Auto Auction Association.
Specifically, the tally for the month of June climbed 8.3 percent against comparable weeks of 2014. Auction volume for the first half of the year was up 7.3 percent, according to the dashboard prepared by NAAA chief economist Ira Silver.
June also represented the largest year-over-year gain in auction volume for any month since January, when volume jumped 10.7 percent.
February’s monthly figure was up 5.4 percent from February 2014, and it was followed by a 4.5-percent gain in March.
Auction volume for April climbed 7.8 percent year-over-year, with May up 7.1 percent.
Dealers should expect a sharp increase in late-model used-vehicle supplies along with significant decreases in used-vehicle values over the next couple of years.
That’s according to the National Automobile Dealers Association, which hosted its Economic Quarterly press briefing on Monday to recap the first half of the year and set its gaze forward.
The NADA’s current forecast estimates that the supply of late-model vehicles, which it specifies as zero- to 5-year-old vehicles, will be 28 percent higher by 2017 than at the end of 2014.
The association’s projection, based on the expectation of increased used-vehicle supply and pressure from new-vehicle sales, would result in a 4.5-percent decrease in used-vehicle prices per year in 2016 and 2017.
Larry Dixon, senior manager of market intelligence for NADA Used Car Guide, said that used-vehicle prices have remained relatively stable up until now despite the ever-present pressure from new-vehicle sales and increased supply of late-model vehicles. He expects the decline in used prices to be relatively tame for the rest of the year.
“NADA forecasted a slight decline of 0.3 percent for used prices of vehicles up to 8 years in age through the first half of 2015, so the year’s result so far has essentially played out as we have expected,” Dixon said. “We expect used-vehicle prices to decline by 2 percent over the second half of 2015 compared to levels recorded year-to-date.”
These comments followed NADA chief economist Steven Szakaly’s review of the new-vehicle industry. On that front, NADA increased its sales expectations for 2015 from 16.94 million to 17.17 million units. Szakaly expects 2016’s results to be a peak; he forecasts a total of 17.62 million new cars and light trucks will be sold next year.
“Purchases and leases of new cars and light trucks will continue as a stronger overall economy continues to drive demand,” Szakaly said. “While we’ve had a slower-than-normal recovery from this recession, we are seeing the sixth consecutive year of new light vehicle sales growth.”
Cox Automotive chief economist Tom Webb reviewed the Manheim Used Vehicle Value Index going back more than two decades to give dealers and finance companies context relating to the latest wholesale-price decline.
Webb indicated wholesale vehicle prices (on a mix-, mileage- and seasonally adjusted basis) dropped for the fourth consecutive month in May, bringing the index reading to 123.8. The level represented a dip of 0.7 percent from a year ago.
“A look at the Manheim Index over its entire 20-plus year history shows that pricing over the past five years has been not only elevated, but stable,” Webb said when the newest index report arrived on Friday.
“Sure, there have been intra-year swings; but over the longer time span, the movements have been modest,” he continued. “Indeed, even with the recent declines in wholesale pricing, the index is only 3.1 percent lower than the peak reached in May 2011 — and that was a peak that was artificially boosted by the supply disruption resulting from Japan’s earthquake.”
Webb also pointed out the current Manheim Index reading is also close to its historic trend line, “whether that line is based on raw data or adjusted for changes in new vehicle prices.”
He went on to discuss what movement might be coming next in light of ongoing changes in the wholesale market and activities inside and outside the lanes.
“With wholesale supplies certain to grow (indeed, accelerate), a movement below trend should be anticipated,” Webb said. “The degree of deviation will be dependent on the ability of basic economic forces — labor market and credit conditions — to continue to support retail used unit volumes and profits.”
Market Segment and Price Tier Trends
Webb explained that May represented a continuation of trend with respect to pricing movements within market classes.
“Namely, compact cars were weak, and pickups were strong,” Webb said. “Luxury cars also continued to underperform the overall market, and within that segment, entry luxury cars were under the greatest price pressure.”
Manheim reported that compact-car prices softened by 6.6 percent in May while pickup prices surged by 6.1 percent. Prices for those luxury units dipped by 1.8 percent, joining the downward price trend that also included midsize cars (down 0.9 percent) and SUVs and CUVs (down 0.7 percent).
The sixth segment Manheim tracks, vans, saw their prices edge up 1.6 percent in May.
“Within the pricing tiers, there was weakness in the $9,000 to $11,000 range and strength in everything above $15,000,” Webb said. “This also represented a trend that has been going on for some time. The volume of vehicles offered in the $9,000 to $11,000 range was up considerably from a year ago.
“Pricing for dealer-consigned units in May was higher than a year ago, and average mileage declined ever so slightly during the month after rising for many years,” he went on to say.
Rental-Risk Unit Analysis
Webb noted that “older, rougher” vehicles dragged down prices in this segment of the wholesale market.
Manheim tabulated that a straight average of auction prices for rental risk units sold in May dropped by more than 10 percent from the year-ago level. After adjusting for broad shifts in market class and mileage, analysts found that the year-over-year decline was still more than 6 percent.
“Much of the remaining decline was a result of older and rougher-condition vehicles being sold,” Webb said.
Webb elaborated his assessment by giving examples In May of last year, he pointed out that 65 percent of the rental risk units sold were from the 2013 model year. But this past month, Webb said only 29 percent of sales were accounted for by 2014 model year vehicles while 57 percent of sales continued to be accounted for by 2013 model-year units.
Likewise, in May of last year, Webb explained 45 percent of the risk units sold at auction had a condition grade of 4.0 or better. In May of this year, he said only 30 percent did.
“Auction volumes for rental risk units were up significantly in May and for the first five months of the year,” Webb said. “Meanwhile, the number of new units sold into rental rose less than 1 percent in May, but was up 9.4 percent year-to-date.”
Consumer Spending on Vehicles
In his usual, to-the-point manner, Webb said that consumers are buying vehicles, but not much else.
He recapped that new cars and light-duty trucks sold at a seasonally adjusted annual rate (SAAR) of 17.7 million in May.
“This was far above expectations, and it was the best pace in nearly a decade,” said Webb, who added that three calendar “quirks” boosted the sales rate. Those elements included:
— Five weekends during the month
— Memorial Day coming early
— The “quaint” notion of adjusting for one less “selling” day
“Expect a June pullback (the selling-day adjustment will go the other way,” Webb said. “Nevertheless, new vehicle sales are strong (the year-to-date pace is 16.8 million), especially given that consumer spending on other items has been weak all year as households increase their savings rate.”
While the new-model market might have a skewed numbers in Webb’s view, the Cox expert insisted the used-vehicle retail market remains “solid.”
Total used-vehicle retail sales rose 5 percent in April, after being down in the first quarter, according to National Automobile Dealers Association.
“Conversations with dealers suggest that the turnaround continued in May,” Webb said. “For certain, CPO sales continued their record pace, with sales up 12.2 percent in May and 11.6 percent year-to-date.
“With dealers’ increasing operating efficiencies, the higher throughput has produced record profits,” he continued.
Webb closed his latest industry analysis with one more point.
“With respect to supporting used-vehicle values, it is encouraging that new-vehicle transaction prices continue to rise, incentive spending is flat, and inventory levels are normal,” Webb said.
“Wholesale used-vehicle prices, as measured by the Manheim Index, are now approximately at their historical trend level with respect to new vehicle prices as measured by the government,” he concluded.
April was a familiar scene in the certified pre-owned and late-model used-car markets.
Sportier vehicles were in high demand and low supply, with one brand drawing the most interest: Porsche.
The certified Porsche models, in particular, are gaining considerable steam with shoppers.
According to the April installment of Autotrader’s Scarcity report, two CPO Porsche models were the most difficult to find certified vehicles in the country.
The Porsche Cayman was once again the most scarce CPO vehicle nationally, followed by the certified Boxster.
The CPO Boxster was sixth in March on the certified scarcity list, but as the CPO Cadillac Escalade fell off the list entirely in April, the Boxster took its No. 2 spot.
“As was the case in March that marked the official arrival of spring, sporty cars made up the preponderance of vehicles on Autotrader's April scarcity list,” said Autotrader senior analyst Michelle Krebs. “In the months leading up to March, many of the vehicles on the list were trucks, sport utilities and crossovers.
Taking a look at regional results, the CPO Boxster topped the list of most sought after models in the Atlanta and New York, Autotrader reported. And the CPO Cayman came out ahead in Los Angeles.
Sportier models dominated the late-model used lists, as well. On a national basis, the Nissan GT-R came in at No. 1, followed by the Audi TTRS, and once again, the Porsche Cayman showed up in the third spot. The used Porsche Boxster was at No. 4.
“The fact that spring has arrived and sports cars are back in fashion combined with the extreme desirability of Porsche vehicles account for the two Porsche models leading the scarcity list,” said Krebs. “But so, too, does Porsche’s strong certified pre-owned program, which Autotrader ranked as 'easily the best in the industry' in the U.S."
Krebs pointed out that the Porsche CPO program is offered on vehicles up to 6 years old, and some CPO models can be up to 8 years old and still be covered by the automaker's factory warranty, helping put shoppers’ minds at ease when shelling out for a high-end luxury unit.
Highlighting a few other brands that touted sporty vehicles in high demand, the CPO Chevrolet Corvette came in at No. 6 on the certified April scarcity chart, up from No. 8 in March. This model was also particularly popular in Washington D.C., topping the list in the nation’s capital. The CPO Corvette was also No. 2 in Atlanta and Dallas/Fort Worth, No. 4 in New York and sixth place in Houston.
Subaru, “known for long-lasting brutes with all-wheel drive,” Krebs said, had two models make the lists — both sporty.
The CPO Subaru BRZ was up to the No. 5 spot on the national list, after coming in at No. 9 in March, and the certified WRX came in ninth.
On a regional market level, the two Subaru units made the least available list in New York, Los Angeles, Boston, Houston, San Francisco/Oakland/San Jose and Philadelphia.
“Subaru, in general, has been enjoying spectacular success, setting new sales records for the past seven years and is on its way to its eighth record. The only thing holding Subaru back is capacity constraints,” Krebs said.
Click below to view the complete late-model used and CPO scarcity charts for April, provided by Autotrader.
For dealers working with budget-conscious shoppers, car technology company Carlypso — which runs the used sales website carlypso.com — has a few suggestions for the best pre-owned deals this spring.
But the company didn’t look to the used dealership lots to find the best offers; analysts turned to the lanes instead.
Citing the wholesale markets as the best indicators behind which cars are “hot” with consumers, Carlypso undertook a study that examined transactions from over 333,526 wholesale vehicle transactions from December 1, 2014 to April 15, 2015.
In looking at which vehicles and segments took the biggest hits in auction price this spring, Carlypso pointed out luxury brands and electric vehicles were at the bottom of the barrel for tax season.
“The Nissan Leaf and other electric cars (including many other year trim combinations) fared vary poorly,” Carlypso analysts said. “Excess supply and diminishing demand caused a 10-percent price drop in just four months on late-model Nissan Leafs. Lease turn-ins make up the majority of volume.”
And though these price declines may be a sign of high supply and low demand for these segments, these units might end up being attractive options for used buyers looking for a deal.
For example, although wholesale prices for 2012 Nissan Leaf SL were up 2 percent from December to the end of March, they fell by 9.45 percent during the same period to finish at an average of $10,894.
And the 2012 BMW 528i dropped from an average of $29,587 to $26,939 over the course of tax season.
“BMW 3 and 5 series both fared poorly. With lots of off-lease inventory, the base model 528i and 328i suffered large residual losses,” Carlypso reported. “Owners might have suffered almost $2,600 drop in value over just four months on the BMW 528i.”
Carlypso also offered the following examples as deals for spring:
- The 2012 Lexus ES350 base model is going for an average of $21,447, down from $23,207 in December.
- The 2011 BMW 328i is going for $18,953 in the lanes, down from $20,170.
- The 2013 Nissan Rogue SV is selling for an average of $16,786, down from $17,672.
- Lastly, the 2013 Honda Civic LX is going for an average of $13,307 in the lanes, down 3.03 percent from December rates.
Carlypso analysts pointed out the ES350 and Civic both experienced accelerated depreciation this spring, even though they are traditionally stronger cars in the lanes when it comes to price retention.
For dealers with customers in the market for BMWs or other lightly used electric and luxury cars, it might be time to push a used purchase since BMW and Nissan most likely won’t be offering new incentive packages that will compete with used sales this spring.