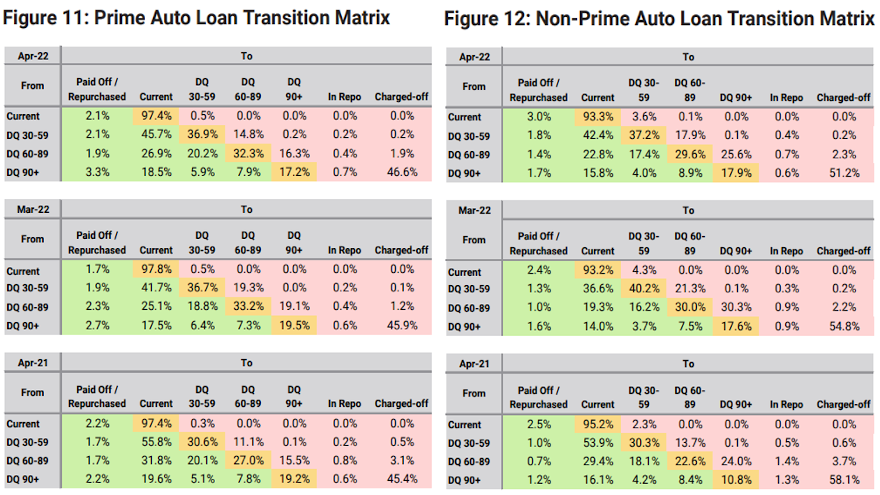
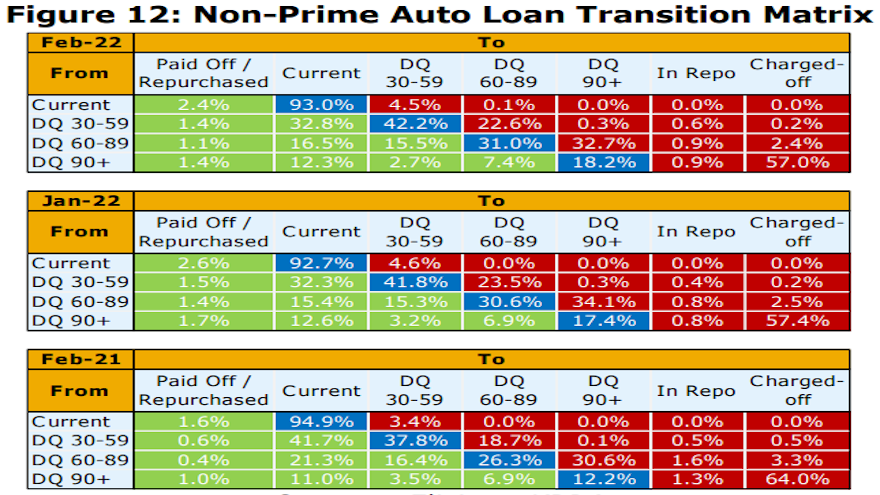
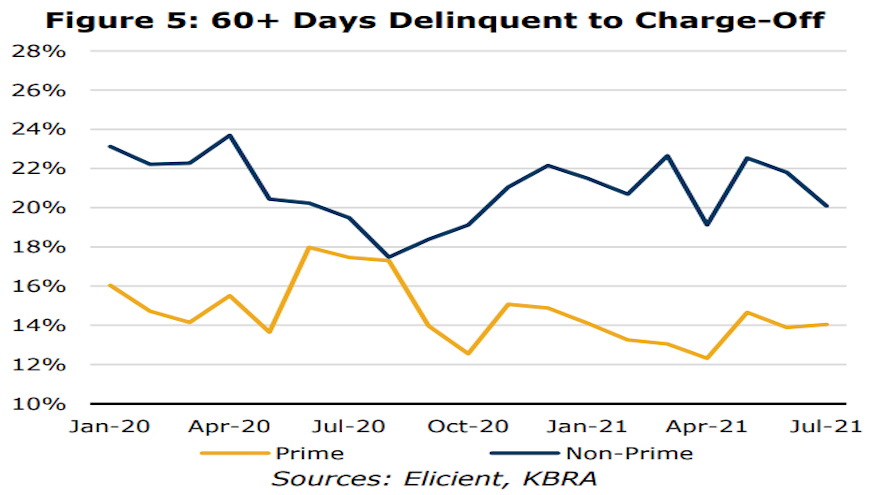
What Kroll Bond Rating Agency (KBRA) has been discussing for much of the year continues to come to fruition.
Analysts said July remittance reports showed a second straight month of deteriorating credit performance and declining recovery rates across securitized prime and non-prime auto finance pools.
According to its latest update, annualized net losses in
Read more
Amazing what federal income tax refunds can do for the health of your portfolio, huh?
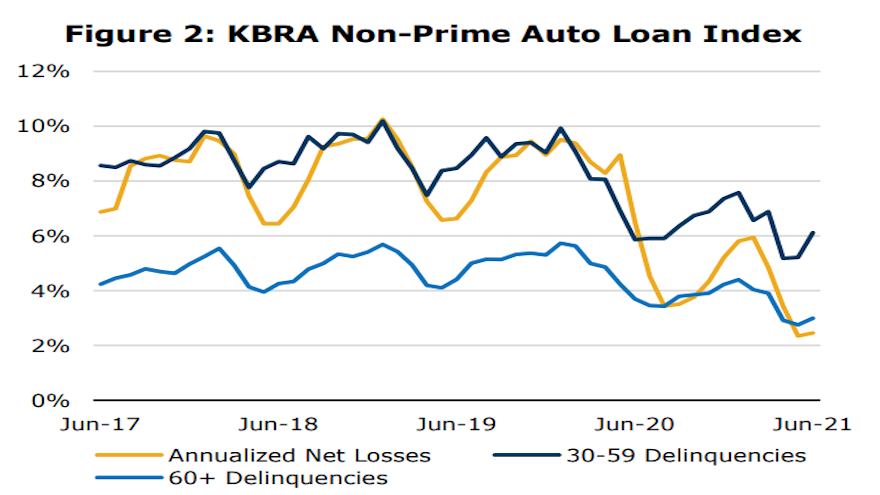
Kroll Bond Rating Agency (KBRA) said April remittance reports showed auto finance credit performance improved for the second consecutive month across both prime and non-prime securitized pools.
According to the firm’s report, annualized net losses in …
Read more
Auto-finance companies looking to gauge collections, delinquencies and defaults continue to get a somewhat murky glimpse of what’s happening in the market.
After the latest update showed a slight dip in defaults, the newest insight from Kroll Bond Rating Agency (KBRA) indicated February remittance reports showed that auto credit performance continued to soften across prime and non-prime securitization pools during the January collection period.
Read more
Kroll Bond Rating Agency (KBRA) released its auto finance ABS indices for July, as analysts used a description that might make many executives and managers a little more confident about how the entire market is behaving.
Read more
A day after S&P Dow Jones Indices and Experian reported that auto defaults sunk to a new all-time low in June, Kroll Bond Rating Agency (KBRA) released its latest indexes based on performance in the securitization market, illustrating how the metrics likely are on the path to notable changes during the rest of the year.
Read more
TransUnion is pretty bullish about the future prospects for the subprime segment of auto financing.
While discussing the metrics contained in the Q1 2021 TransUnion Industry Insights report, senior vice president and automotive business leader Satyan Merchant explained how that data coupled with a handful of other trends could lead to a lift in originations within subprime.
First, let’s get into the information TransUnion shared on Wednesday.
Analysts indicated the broader auto-finance market continued to recover during the first quarter, with average outstanding balance per contract topping $20,000 for the first time since TransUnion began tracking the metric.
TransUnion noted that originations — viewed one quarter in arrears to account for reporting lag — continued to increase in Q4 2020, though at a slower rate than Q3. Analysts acknowledged the slowdown is primarily due to fewer contracts originated in subprime.
However, TransUnion said in a news release that early counts in Q1 point to some recovery happening for this subset of the population.
Analysts also determined serious delinquency rates for contracts 60 days or more past due increased in Q1, moving to 1.51% from 1.37% year-over-year. They explained the slight rise in aggregate delinquency rates is, in part, driven by lower subprime originations.
Vintage analysis is showing that auto portfolios across all risk tiers remain healthy, according to TransUnion.
“The auto finance market continues its recovery after encountering the depths of the pandemic last year,” Merchant said in the news release. “The strength of originations, balances and loan performance point to a market where lenders have continued to make credit available to borrowers; while government stimulus, falling unemployment and tax refund season have all helped strengthen household balance sheets.
“All of these factors point to rebound in subprime originations in Q1 2021 and beyond,” he continued. “While overall delinquency rates continue to rise, they appear to be at manageable levels.
“At the onset of the pandemic, there was a fear that we might see a major spike in auto delinquency rates, especially as most consumers were locked down in their homes,” Merchant went on to say. “That fear never materialized and we anticipate more auto loan growth and continued good performance in the near future.”
TransUnion plans to get deeper into its report during a free webinar on May 26. Registration for the session can be completed on this website.
Q1 2021 Auto Loan Trends
|
Auto Lending Metric
|
Q1 2021
|
Q1 2020
|
Q1 2019
|
Q1 2018
|
|
Number of Auto Loans
|
83.2 million
|
83.8 million
|
82.2 million
|
79.7 million
|
|
Borrower-Level Delinquency Rate (60+ DPD)
|
1.51%
|
1.37%
|
1.31%
|
1.32%
|
|
Average Debt Per Borrower
|
$20,001
|
$19,302
|
$18,845
|
$14,837
|
|
Prior Quarter Originations*
|
6.7 million
|
6.9 million
|
6.7 million
|
6.6 million
|
|
Average Balance of New Auto Loans*
|
$24,677
|
$22,764
|
$22,128
|
$21,678
|
*Note: Originations are viewed one quarter in arrears to account for reporting lag. Source: TransUnion.
Perhaps one of the clearest data examples of how extensions or other contract modifications impact delinquencies and defaults within a short timeframe arrived this week courtesy of S&P Global Ratings, S&P Dow Jones Indices and Experian.
First, let’s look at the extensions recorded in December on auto financing within public asset-backed securities (ABS). S&P Global Ratings discovered they increased significantly.
For the public prime pools that analysts track, extensions soared 32.5% to 0.73%. For public subprime pools, they jumped 19.2% to 4.84%.
S&P Global Ratings attributed the increases to the following factors:
• Normal seasonal behavior due to customers often falling behind on their credit obligations at year-end
• COVID-19-related impact as many consumers remained out of work or had their hours trimmed due to business restrictions to combat the rise in infection rates
• Finance companies giving contract holders more time to make their payments as many individuals would receive stimulus checks of $600 per person (and an additional $600 per child) in January.
With December’s spike in extension rates, S&P Global Ratings reported that deferrals reached their highest levels since the summer.
On average, analysts said 60% of the prime accounts (on a dollar basis) that were 60-plus-days delinquent as of the end of December were accounts that were previously extended since March. In subprime, analysts noted the percentage was 68%.
“Early indications are, however, that January will show a significant improvement,” S&P Global Ratings said.
Well, speaking of January information, S&P Dow Jones Indices and Experian released their data through January for the S&P/Experian Consumer Credit Default Indices.
The auto default rate dropped 8 basis points on a sequential basis to 0.56% in January. That reading is 43 basis points lower than a year ago.
Auto defaults haven’t been above 1% in this monthly tracker since the close of 2019 when analysts pegged it at 1.02%, closing a stretch of four consecutive months at 1% or higher.
The lowest auto default reading ever recorded by S&P Dow Jones Indices and Experian came in June when modification soared because of the pandemic. It bottomed out at 0.40%, then rose for five straight months.
Meanwhile, the composite rate — which represents a comprehensive measure of changes in consumer credit defaults — moved 2 basis points higher in January compared to the previous month to land at 0.48%.
In other credit segments, analysts reported the bank card default rate rose 9 basis points to 2.72%. and the first mortgage default rate ticked up 3 basis points to 0.32%.
Looking at the five largest cities S&P Dow Jones Indices and Experian track each month, four generated higher default rates in January versus the previous month.
Miami increased the most with a gain of 9 basis points to come in at 0.95%, while New York wasn’t far off that pace, rising 7 basis points to 0.49%.
Chicago and Dallas each edged up 1 basis point to 0.53% and 0.57%, respectively.
Los Angeles was the only one of these five metropolitan areas to show a decrease, dipping 3 basis points to 0.32%.
Jointly developed by S&P Indices and Experian, analysts noted the S&P/Experian Consumer Credit Default Indices are published monthly with the intent to accurately track the default experience of consumer balances in four key loan categories: auto, bankcard, first mortgage lien and second mortgage lien.
The indices are calculated based on data extracted from Experian’s consumer credit database. This database is populated with individual consumer loan and payment data submitted by lenders to Experian every month.
Experian’s base of data contributors includes leading banks and mortgage companies and covers approximately $11 trillion in outstanding loans sourced from 11,500 lenders.
TransUnion discovered that finance companies originated paper at an overall pace during the third quarter of last year resembling what analysts spotted during Q3 of 2019.
When looking closer at the subprime market, however, TransUnion found originations are lagging. Analysts pegged the year-over-year decline at about 21% since subprime originations made up approximately 860,000 of the 7.32 million contracts flowing into portfolios during Q3.
For reference, TransUnion indicated 1.09 million of the 7.45 million contracts booked in Q3 2019 fell into the subprime category.
The data arrived through TransUnion’s Q4 2020 Industry Insights Report released on Thursday.
“A tightening in auto lending standards would generally be the primary reason for such a precipitous drop in subprime origination activity,” TransUnion senior vice president and auto line of business leader Satyan Merchant said in a news release, which reiterated originations are viewed one quarter in arrears to account for reporting lag.
“We’ve conducted further analysis that demonstrates that, in this case, it could be a combination of lagging consumer demand and adjustments in lending criteria,” Merchant continued. “This revelation points to the outsized economic impacts some subprime borrowers are feeling as a result of COVID-19.”
Meanwhile, TransUnion was able to share Q4 metrics for auto delinquencies, which include contract payments that are 60 days or more past due.
TransUnion’s overall 60-day delinquency rate rose to 1.57% in Q4 2020 from 1.50% the previous year. Looking closer at the subprime segment, the increase was even more pronounced. Analysts said it climbed from 7.41% to 9.05% year-over-year.
All told, TransUnion determined there were 83.5 million outstanding installment contracts at the close of 2020, down slightly from the close of 2019 (83.8 million) and up from the end of 2018 (82 million).
Furthermore, TransUnion said balances continued to grow on a year-over-year basis, rising 3.5% to $1.33 trillion. Analysts added the average outstanding balance on those current contracts sat at $19,818, which is more than $1,200 higher than the end of 2017.
“The recovery observed in the auto lending market since the height of the pandemic has been a positive sign,” Merchant said. “The auto marketplace is unique in that originations activity may be more impacted by a lack of demand, whereas some of the other credit products have seen slower loan activity due to limited supply.
“We will likely have a better picture of what is to come in the auto lending industry as more accounts exit both auto and mortgage accommodation programs,” he went on to say.
Q4 2020 Auto Loan Trends
|
Auto Lending Metric
|
Q4 2020
|
Q4 2019
|
Q4 2018
|
Q4 2017
|
|
Number of Auto Loans
|
83.5 million
|
83.8 million
|
82 million
|
79.4 million
|
|
Borrower-Level Delinquency Rate (60+ DPD)
|
1.57%
|
1.50%
|
1.44%
|
1.43%
|
|
Average Debt Per Borrower
|
$19,818
|
$19,202
|
$18,858
|
$18,597
|
|
Prior Quarter Originations*
|
7.3 million
|
7.5 million
|
7.2 million
|
7.1 million
|
|
Average Balance of New Auto Loans*
|
$23,727
|
$22,232
|
$21,520
|
$20,909
|
*Note: Originations are viewed one quarter in arrears to account for reporting lag. Source: TransUnion.
Other credit market performances
As Merchant referenced, TransUnion’s report delved into other parts of the credit market, including personal loans that sometimes are held by subprime consumers, too.
Analysts indicated unsecured personal loan lenders continue to be cautious as originations in Q3 2020 were 30.7% lower than the prior year, but grew strongly quarter-over-quarter, indicating a gradual ramp-up in volume.
TransUnion determined serious delinquency rates increased slightly by 15 basis points in Q4 2020 on a quarterly basis, though remained 78 basis points lower than Q4 2019. The relatively low level of lending resulted in total outstanding balances falling again in Q4 2020 to $148 billion.
TransUnion senior vice president and consumer lending business leader Liz Pagel mentioned that continued availability of lender hardship programs, in addition to eviction moratoriums and decreased consumer spending, helped keep delinquencies and new charge-off balances low.
“The recent approval of another stimulus package and the potential for additional payments and the extension of federal unemployment benefits should help keep delinquencies and charge-offs at low levels in the near term even as lenders re-enter the market,” Pagel said.
“High savings rates and low credit card balances may continue to depress demand for debt consolidation loans, which could impact originations until lockdowns subside and consumers begin spending more,” she continued. “The end to lender forbearance programs, particularly mortgage, could impact delinquency rates, and later could drive more demand for credit as current liquidity sources are depleted.”
Also of note, TransUnion reported that mortgage originations continued to surge in Q3 2020, reaching nearly 4 million loans. Analysts said that’s the highest level of originations since the Great Recession and 67% higher than last year at the same time.
According to the report, mortgage originations were spread out evenly between refinancing and new purchases, with a 52% refinance share and 48% purchase share.
“On the surface, the consumer credit market is performing quite well. Serious delinquency levels remain near record lows while balance and origination activity is picking up,” said Matt Komos, vice president of research and consulting at TransUnion. “Additional stimulus and flattening unemployment rates point to a continuation of this trend.
“However, the performance of those accounts still in accommodation will help shape the true consumer credit picture,” Komos continued. “With many accounts expected to come out of accommodation between March and May, most notably mortgage accounts, we will soon see the true impact of those programs for both consumers and the credit marketplace.”
For more information about the report, register here for a webinar TransUnion is hosting on Wednesday.
While the number of accounts TransUnion classifies as being in some form of financial hardship status closed the year below a peak registered soon after the onset of the pandemic, the level remains notably elevated and isn’t softening at the pace analysts spotted earlier.
According to TransUnion’s latest Financial Services Monthly Industry Snapshot Report released this week, analysts indicated approximately 2.87% of accounts in the auto, credit card, mortgage or unsecured personal loan industries remained in financial hardship status at the end of December.
TransUnion pointed out the percentage of accounts in financial hardship continues to decline from a peak of 4.77% observed in May.
TransUnion’s financial hardship data includes all accommodations on file at month’s end and includes any accounts that were in accommodation before the COVID-19 pandemic. While the percentage of accounts in this status has decreased, TransUnion said the declines have slowed in recent months.
Furthermore, TransUnion consumer research has found that repayment preferences vary among surveyed consumers with loan accommodations.
For instance, analysts noted in a news release that approximately 25% of consumers want to resume regular payments and work with the finance company to extend the length of the loan. TransUnion also said that 19% of consumers want to extend the accommodation; and the credit bureau added that 17% of consumers would like to create a repayment plan to catch up while making larger payments.
“There are still hundreds of thousands of consumers in some form of financial hardship status, and the more lenders can do to understand their customers’ financial situations, the better they can assist them and build trustworthy, long-lasting relationships,” said Jason Laky, executive vice president and head of TransUnion’s financial services business.
Accounts in Financial Hardship Status Declining, but Still Elevated
|
Date/Credit Product
|
Auto Loans
|
Credit Cards
|
Mortgages
|
Personal Loans
|
|
December 2020
|
2.93%
|
2.42%
|
5.36%
|
3.36%
|
|
November 2020
|
3.22%
|
2.21%
|
5.85%
|
3.60%
|
|
October 2020
|
3.64%
|
2.14%
|
5.44%
|
3.87%
|
|
Peak Level*
|
7.21%
|
3.73%
|
7.48%
|
7.03%
|
|
March 2020
|
0.64%
|
2.15%
|
0.48%
|
1.56%
|
*Note that peak levels for auto loans and personal loans took place in June 2020 and in May 2020 for credit cards and mortgages. Source: TransUnion.
To assist finance companies with their customer relationships, TransUnion has introduced the CreditVision Acute Relief Suite.
The suite can enhance support for consumers with accommodations, allowing finance companies to develop effective customer management strategies across the account lifecycle.
TransUnion mentioned this solution also can provide consumers more opportunities to work with their lenders to ensure they can repay their loans when coming out of accommodation.
“We’ve worked with many lenders in the past six months to ensure they are identifying and supporting consumers who may need financial help,” Laky said.
“As we begin 2021, and accommodation programs begin to expire in March and April, these insights will be especially beneficial to lenders and consumers alike,” he continued.
Laky went on to mention that the CreditVision Acute Relief Suite features trended credit attributes that identify credit relationships and payment behaviors for consumers previously or currently in relief status during acute economic conditions.
Furthermore, the suite provides lenders and insurers with greater access to critical insights that improve their ability to understand how consumers and their accounts have been impacted. It includes details broken out by different credit products, the timing of when the accounts were reported in these statuses, and the balances of those accounts.
“These are challenging times that call for innovative strategies,” Laky said.
“The effective use of solutions combined with approaches already set forth by businesses and lenders will be major determining factors for enabling a thriving consumer credit market and empowering economic opportunity for consumers in 2021,” Laky added.
Experian senior director of automotive financial solutions Melinda Zabritski made a suggestion to finance companies after Experian released its Q3 2020 State of the Automotive Finance Market report on Thursday.
The recommendation came in connection with a metric that providers might already watch with a laser focus — delinquencies — even as the subprime segment continues to shrink to a new low.
According to the report, 30- and 60-day delinquency rates improved in the third quarter, coming in at 1.56% and 0.51%, respectively.
Comparatively, a year ago, Experian reported the 30-day delinquency rate stood at 2.25% and the 60-day delinquency rate sat at 0.75%.
“While the decline in 30- and 60-day delinquency rates is a positive trend for the industry, particularly with some of the accommodation programs coming to an end, we do need to consider the impact these programs have had on consumers,” Zabritski said in a news release.
“Some consumers likely leveraged financial assistance programs to manage through hardship, so it’s important for lenders to keep a close eye on how delinquency rates evolve over the coming quarters,” she continued. “Nonetheless, the improvement is a positive sign for the country’s economic recovery.”
Overall, the industry is taking on less risk as Experian pegged the subprime segment of all financing at 19.23% in the third quarter, representing a record low in its database.
And in Q3, analysts added that deep subprime financing remained below 3% of the overall market.
Beyond influencing consumers’ ability to manage monthly payments and perhaps how much appetite finance companies have for subprime, Experian pointed out the pandemic also has impacted overall volume.
However, despite fewer vehicle sales, analysts discovered outstanding balances still grew 2.8% from a year ago, reaching $1.2 trillion. This increases also comes at a time where a smaller percentage of vehicles are being financed.
Experian indicated the percentage of new vehicles with financing was 82.43% in Q3 compared to 86.99% the previous year. Similarly, the percentage of used vehicles with financing was 33.71% in Q3 compared with 39.79% over the same period.
“It is important to note, the drop in the percentage of vehicles with financing can also be attributed to an increase in cash transactions,” Experian said.
Prime consumers continue to opt for used vehicles
During the first few months of the pandemic, Experian recapped that automakers offered new-vehicle incentives to improve sales. As a result, analysts saw prime borrowers opt for new vehicles, reversing a trend they observed in previous quarters.
With fewer incentives offered during the third quarter, Experian found that a higher percentage of prime consumers shifted back to used.
In fact, analysts reported prime and super prime contract holders made up 55.3% of used vehicles financed during the quarter, a new high for used-vehicle financing.
Experian sees the shift back to the used vehicle market is likely driven by continued affordability conversations; a metric that Cox Automotive and Moody’s Analytics recently chose to track more closely.
The newest Experian report showed both the average amounts financed for both new and used vehicles increased in Q3.
The average amount financed for a new vehicle rose more than $2,000 over the previous year, reaching $34,635, while the average amount financed for a used vehicle climbed $945 to $21,438 over the same period.
Analysts explained the increases could also be attributed to consumer preference, with buyers leaning toward larger, more expensive vehicles.
Experian noted that small SUVs were the most purchased vehicles, making up 26.01% of contracts in Q3, followed by midsize SUVs at 24.15%.
Despite the increases in average amounts finance, Experian mentioned the increases in average monthly payment weren’t as sharp.
To be exact, analysts said the average new-vehicle payment amount increased $11 year-over-year, reaching $563 in Q3. The average used-vehicle payment ticked up $6 to $397.
To keep those monthly payment manageable, finance companies are absorbing more risk by stretching terms and edging rates lower.
Experian determined the average term for new vehicles financed during the third quarter increased slightly to 69.68 months, up from 68.98 months a year earlier. And the average term for used vehicles financed in Q3 increased from 64.49 months to 65.15 months.
Analysts went on to note that the average interest rate for a new-vehicle contract booked in Q3 saw sharp decrease, sliding from 5.38% in Q3 of last year to 4.22% in Q3 of this year. The average interest rate for used-vehicle paper originated in Q3 dropped from 9.09% to 8.43% year-over-year.
“With affordability still top of mind, particularly during the pandemic, lower interest rates have certainly helped consumers keep monthly payments at a manageable level,” Zabritski said.
“As the market evolves and financial situations shift, it’s important for lenders and dealers to stay close to the trends and make strategic decisions that help keep the industry moving forward and consumers in their vehicles.”
Additional findings for Q3
Experian closed its latest update by mentioning a trio of other trends, including:
• Average credit scores saw a sharp increase for new vehicles, jumping from 728 in Q3 2019 to 732 in Q3 2020. The average credit score for used vehicles also saw a one-point increase from 664 to 665 year-over-year.
• New-vehicle leasing continued decrease in Q3 2020, comprising 26.2% of new-vehicle financing, compared to 30.27% in Q3 2019.
• Captive finance companies continued to increase market share, rising from 30.85% in Q3 2019 to 34.49% in Q3 2020. The buy-here, pay-here segment saw a slight increase from 4.32% to 4.69%, while all other provider categories sustained year-over-year decreases.
To view the entire Q3 2020 State of the Automotive Finance Market report webinar, go to this website.