As we enter the fall market, auction prices are continuing to weaken.
According to NADA AuctionNet data, prices are expected to drop by 0.7 percent or $100 this week.
That’s after cars dropped by an average of $66 and the trucks fell by $45 last week, according to Black Book data.
All the segments NADA tracks are expected to see price declines this week, sans one.
Interestingly, though most high-end units have been softening in the lanes, luxury utilities are expected to see prices grown by 0.3 percent or $75, marking the only segment predicted to see price increases this week.
On the other hand, the percentage price drops will be led by the compact segment, according to AuctionNet data. This segment is predicted to fall by 1.3 or $125 this week.
The large pickups are expected to follow with one of the biggest monetary drops, falling by 1.2 percent or $250.
Analysts expect prices to continue falling in this segment as unusually strong price retention for this segment in the first half of the year is causing a bit of a market correction.
Losses for the remaining segments will be less significant, said David Paris, NADA automotive analyst.
Four- and two-week AuctionNet wholesale average prices are created by collecting all AuctionNet records for vehicles up to five years of age for a specified period of time. Prices are then adjusted for changes in mileage and mix.
Current week prices are based on NADA's proprietary used vehicle value model which includes assumptions for new-vehicle prices, used-vehicle supply, gasoline prices and other economic factors.

| NADA Segment |
Average AuctionNet® Wholesale Price |
2-Week v. Current |
| Compact Car |
$10,150 |
$10,000 |
$9,875 |
-1.3% |
($125) |
| Compact Utility |
$14,175 |
$14,075 |
$13,950 |
-0.9% |
($125) |
| Industry |
$14,875 |
$14,675 |
$14,575 |
-0.7% |
($100) |
| Large Pickup |
$21,825 |
$21,675 |
$21,425 |
-1.2% |
($250) |
| Large SUV |
$26,425 |
$26,175 |
$26,050 |
-0.5% |
($125) |
| Luxury Car |
$20,075 |
$20,000 |
$19,900 |
-0.5% |
($100) |
| Luxury Utility |
$25,125 |
$25,175 |
$25,250 |
0.3% |
$75 |
| Mid-Size Car |
$11,600 |
$11,475 |
$11,400 |
-0.7% |
($75) |
| Mid-Size Utility |
$17,975 |
$17,650 |
$17,550 |
-0.6% |
($100) |
| Mid-Size Van |
$14,425 |
$14,300 |
$14,250 |
-0.3% |
($50) |
Taking a look at last week’s auction price movement, Black Books editorial director Ricky Beggs said it is evident the industry is “fully engaged in the beginning of the fall market.”
We have now officially begun the season, and the signs are showing in the lanes.
Beggs pointed out in his latest “Beggs on the Used Car Market” video report that overall price movement as well as a growing number of no-sales is indicative we have hit autumn at the auction.
Last week's price movement echoed the prior week, when price drops heated up in the lanes.
That said, Beggs pointed out the weakness often associated with a full-fledged fall market hasn’t hit yet, as 24 percent of the 1,850 vehicles adjusted daily last week were increases.
“That is not an overly large level, but it is greater than any week since the week ending July 11, 2014, which came in at 27 percent. Last year for this time through the first of November the levels ranged from only 9 percent up to 18 percent,” Beggs said.
“We are keeping our eyes on the current used market to see if and when the market jumps into full fall mode,” he added.
Taking a look at the truck segments, prices fell by an average of $45, which is the lowest drop in the past four weeks.
The compact and full-size pickups once again led the pack in retention, dropping by only $6 last week.
The midsize SUVs stayed consistent this past week, dropping by an average of $20, after seeing prices fall by $16 the previous week.
“Last week we reported some significant decreases in values in all of the full-size utilities. Each of those had smaller, and more typical changes this past week,” Beggs said.
Looking at the price movement for the cars last week, Beggs said the $66 drop “is pretty consistent with the pattern of changes of the cars over the past 11 weeks.”
Entry level cars continue to buck the trend with a $12 drop last week. This segment has seen the lowest depreciation among the cars over the past three weeks, according to Black Book data.
“It is interesting that even with the lowering gas prices all of the four more fuel efficient segments are under the overall segment level change,” said Beggs.
To view the latest "Beggs on the Used Car Market" report, see the video above.
Higher-end models continue to see some of the biggest price declines in the lanes as we head toward cooler weather.
NADA predicts wholesale prices to drop by an average of 1 percent, or $150, this week, with the luxury models seeing some of the biggest declines.
For instance, luxury cars are expected to see a decline of around 1 percent this week.
Black Book’s Ricky Beggs also recently highlighted this trend in his latest video report, noting the real “softness” in the market for the cars and trucks is centered around the more expensive units, while the less expensive vehicles are holding their prices.
That said, large SUVs and compact cars are also expected to experience price drops equal to or above 1 percent this week, according to NADA data.
Consumer interest may be playing a role in the softness of compact car prices, as interest tends to wane when fuel prices drop.
According to Energy Information Administration data released this week, the average price of regular grade gasoline fell by five cents per gallon to rest at $3.41 last week.
Leading the expected declines this week is the midsize utility segment, which is expected to see prices drop by 1.3 percent or $225, according to NADA AuctionNet data.,
Also expected to see significant declines are the luxury utility and midsize car segments, which are expected to fall by 0.8 percent and 0.9 percent, respectively.
Losses for the remaining segments NADA tracks are expected to be less extreme.
Four- and two-week AuctionNet wholesale average prices are created by collecting all AuctionNet records for vehicles up to 5 years of age for a specified period of time. Prices are then adjusted for changes in mileage and mix.
Current week prices are based on NADA's proprietary used vehicle value model which includes assumptions for new-vehicle prices, used-vehicle supply, gasoline prices, and other economic factors.
| NADA Segment |
Average AuctionNet® Wholesale Price |
2-Week v. Current |
| 4-Week Average |
2-Week Average |
Current Week |
% Change |
$ Change |
| Compact Car |
$10,250 |
$10,150 |
$10,050 |
-1.0% |
($100) |
| Compact Utility |
$14,275 |
$14,125 |
$14,100 |
-0.2% |
($25) |
| Industry |
$15,000 |
$14,825 |
$14,675 |
-1.0% |
($150) |
| Large Pickup |
$22,000 |
$21,700 |
$21,625 |
-0.3% |
($75) |
| Large SUV |
$26,650 |
$26,250 |
$25,975 |
-1.0% |
($275) |
| Luxury Car |
$19,975 |
$20,050 |
$19,825 |
-1.1% |
($225) |
| Luxury Utility |
$24,900 |
$25,225 |
$25,025 |
-0.8% |
($200) |
| Mid-Size Car |
$11,700 |
$11,600 |
$11,500 |
-0.9% |
($100) |
| Mid-Size Utility |
$18,250 |
$17,900 |
$17,675 |
-1.3% |
($225) |
| Mid-Size Van |
$14,575 |
$14,425 |
$14,400 |
-0.2% |
($25) |
Price drops in the lanes heated up this past week, with both the cars and trucks seeing larger declines.
According to the latest “Beggs on the Used Car Market” report, the car segments saw prices drop by an average of $73, while trucks fell by an average of $64.
Black Book editorial director Ricky Beggs pointed out both these numbers mark greater declines than the prior week.
That said, the stats look very similar to this time last year for the cars – during the same week last year, car segments saw a drop of $77.
And though a $64 drop might not seem like a lot, this is actually the largest drop for the trucks since the week of Feb. 21.
The truck segments have seen consistently stronger-than-average price drops this year, so it seems the pickup market is experiencing some corrections in the second half of the year.
“This level of change within the trucks did not really occur with any consistency in 2013 until a little later in the year, around the middle of October and first part of November,” said Beggs. “We will keep our attention on these segments to see if this level of change will continue overall through the remainder of 2014.”
Seeing the heaviest declines this past week were the luxury SUVs and the full-size SUVs, which fell by $240 and $133, respectively.
“Two weeks ago the full-size crossovers stood out with a change of minus-$195, and was still at a noticeable level this week, even though much less at minus-$87. There is no question about the large utilities and a pattern of larger adjustments,” Beggs reported.
Beggs pointed out the real “softness” in the market for the cars and trucks is centered around the more expensive units, while the less expensive vehicles are holding their prices.
The smaller declines last week were seen among the entry midsize cars, the entry level cars and the compact cars.
Interestingly, Beggs pointed out this trend may be a sign of the economy, as gas prices are low and are having little to no impact on wholesale prices.
To view the latest “Beggs on the Used Car Market” video report, see above.
Prices continued dropping at the auction this August, and overarching trends remained unchanged: the groups with the biggest declines in the lanes are still the luxury and fuel-efficient segments.
And these trends are causing many analysts to take another look at where prices will stand in the lanes come year-end.
“Despite our projection that 2014 will end the year slightly higher than we saw in 2013, the gap between the year-over-year average vehicle prices has decreased from $711 in May 2014 to just $165 in August 2014,” said Alec Gutierrez, senior analyst for Kelley Blue Book’s KBB.com.
According to the August Kelley Blue Book Report, the luxury segments once again saw the biggest price drops, while the vans and full-size sport vehicles were some of the strongest performing units this past month.
Following a downward trend seen most of this summer, luxury and near-luxury segments saw their prices fall by 3.2 and 3.3 percent, respectively.
The entry-level luxury segment was the worst performing segment last month, with prices dropping by over 3 percent.
KBB pointed out that since May, this segment has seen prices drop by 7.2 percent — and values sit 4.2 percent lower than they did a year ago.
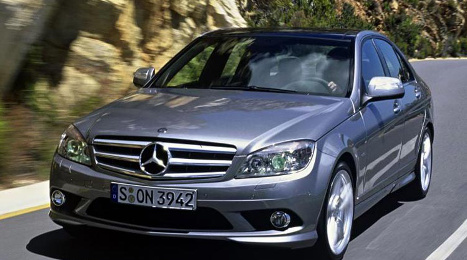
A few of the worst performers in the segment were the Mercedes-Benz C-Class (down 5.1 percent), BMW 3 Series (down 4.7 percent) and the Infiniti G (down 3.1 percent).
“Interest in these vehicles may be getting sidetracked by the newer varient of each vehicle,” said Gutierrez. “The Mercedes-Benz C-Class is all new for 2015, BMW released the 4 Series this year and Infiniti effectively replaced the G model with the Q50/Q60 for 2014.”
The subcompact segment also saw prices drop considerably this past month — in part due to the drop in fuel prices.
Subcompact prices fell $241 year-over-year last month, while fuel prices have fallen 20 cents since June, according to the report.
Kelley Blue Book projects fuel prices to continue on a downward trajectory through the remainder of the year and into 2015.
”As expected, the average price of a subcompact vehicle is significantly lower than this time last year due to decreasing fuel prices,” said Gutierrez. “More fuel-efficient vehicles outside of the subcompact segment also have offset demand for vehicles within this segment. As larger vehicles improve their fuel economy, there is less demand for their smaller vehicle counterpart.”
It also seems we are seeing some market correction of pickup prices that remained unusually strong during the first and second quarter of the year.
This past month, prices for full-size pickups dropped 0.9 percent from July, which KBB predicts is most likely due to normal seasonal depreciation.
That said, rates for these units still sit 5.8 percent higher than August 2013. KBB attributes this spike to strength in the residential construction.
On the other hand, the van and full-size sport utility segments were some of the best performing segments in August, with declines of only 0.5 and 0.7 percent, respectively.
Analysis from Black Book and Manheim for how the wholesale market behaved in August showed somewhat similar conclusions even though the exact figures each company shared differed slightly.
As the Manheim Used Vehicle Value Index retreated for the fourth month in a row, Black Book data showed the average price of a used vehicle for the model years 2009 through 2013 saw a slight improvement in August. Black Book pegged the overall depreciation dip for August at 1.3 percent compared with 1.5 percent in July.
Analysts found that domestic cars changed the most by depreciating 2.5 percent while import cars depreciated 1.6 percent. Black Book said domestic trucks depreciated 1.1 percent; and import trucks softened by 0.8 percent.
Black Book reiterated that average pre-recession depreciation is historically between 1 percent and 2 percent monthly. Analysts expect this year’s overall depreciation figure to come in at 13.5 percent.
“The lower depreciation rate in August counters the expected seasonal pattern, particularly since the new 2015 models typically force larger depreciation on late-model units this month, and second-half depreciation is still expected to accelerate through the remainder of 2014,” Black Book said.
For the second straight month, analysts noted, full-size passenger vans showed the strongest monthly retention, recording an uptick of 0.1 percent and becoming the only segment showing positive change. Vehicles in this segment include the Dodge Sprinter, Ford E-Series and Chevrolet G-Series.
Black Book pointed out that compact SUVs saw the second-best monthly depreciation rate, ticking down just 0.2 percent for vehicles such as the Jeep Wrangler and Nissan Xterra. Analysts computed the average segment price at the end of August was $20,293, a 5.3-percent drop from year-ago levels ($21,425).
Meanwhile, for the third-straight month, Black Book indicated premium sporty cars led all car segments with the lowest depreciation, registering a decline of 1.1 percent in August and 0.9 percent in July. Leading the charge are vehicles such as the BMW 6-Series, Mercedes-Benz CL-Class, BMW M6, Audi R8, Audi S8, Mercedes-Benz SL-Class and Cadillac XLR. The average segment price at the end of August was $48,151, representing a 12.3-percent drop-off compared to a year earlier ($54,898).
Conversely, Black Book determined entry-level cars led all segments with the highest monthly depreciation in August at 4.1 percent. Vehicles in this segment include the Chevrolet Aveo, Honda Fit, Kia Rio, Nissan Versa and Toyota Yaris. The average segment price at the end of August was $8,157, settling 14.7 percent lower than the same month last year ($9,562).
And cargo minivans led all truck segments with the highest monthly depreciation at 3.3 percent, covering units such as the Dodge Caravan, Ford Freestar, Dodge Grand Caravan and Ford Transit. The average segment price at the end of August decreased to $11,192, signaling a 11.9 percent change from a year ago ($12,698).
Black Book editorial director Ricky Beggs — one of the featured panelists during Used Car Week — mentioned that the top 10 best-performing segments were all trucks, and the four truck segments not in the top 10 were compact CUVs (down 1.3 percent monthly), passenger minivans (down 1.5 percent), full-size CUVs (down 2.1 percent) and cargo minivans.
“The near-term outlook for trucks continues to show significant retention strength and these segments are clearly driving the industry as a whole,” Beggs said. “While the trucks are outperforming seasonal trends currently we’re not surprised to see segments such as entry-level cars and entry mid-size cars showing the largest depreciation.”
3 Factors Push Manheim Index Lower
Turning back to the latest report from Manheim, chief economist Tom Webb — who also will be featured throughout Used Car Week — indicated that wholesale used vehicle prices (on a mix-, mileage-, and seasonally adjusted basis) declined 0.7 percent in August. This was the fourth consecutive monthly decline and brought the August Manheim Used Vehicle Value Index reading to 121.8, down 0.4 percent from a year ago.
Webb explained the recent downward movement in wholesale pricing reflects three elements, including:
— A reversion to trend levels after an extended period of exceptionally strong pricing
— Increased wholesale supplies; and
— In recent months, moderating retail demand
Webb also pointed out that August’s index reading of 121.8 puts it right on the trend line for the entire series dating back to 1995.
“The trend line naturally has an upward slope since the Index represents a dollar amount, not a residual percentage,” Webb said. “Fundamentals, and history, now suggest the index will move into an extended period below trend.
“However, we do not expect that the coming deviation from trend will be as pronounced as the 10 performance underperformance in early 2003 or 17 percent shortfall that occurred in December 2008,” he continued. “In both of those instances, a weakening economy and tight credit amplified the normal cyclical swing in wholesale pricing. Today, employment growth is improving and retail credit conditions remain favorable.”
While the overall reading dipped 0.4 percent year-over-year, prices for two vehicle segments Manheim tracks for its monthly index reports moved higher. Leading the way was prices for trucks (up 6.4 percent) followed not too far behind by vans (up 3.6 percent).
The other four segments included in the index report all posted price declines, with luxury cars softening the most at 5.2 percent. Prices for compacts dipped 1.4 percent year-over-year as prices for both midsize cars and SUVs/CUVs each ticked 0.8 percent lower.
“Mileage and seasonally adjusted prices for major market classes showed only pickups and vans (especially cargo vans) up year-over-year. Luxury cars remained the segment with the largest decline in wholesale pricing over the past year, but the pace of decline for this segment in August was not out of line with the overall market,” Webb said.
“Our analysis of average mileage by price tiers showed that the strongest pricing in August remained in the $13,000 to $15,000 range, whereas the weakest pricing was in the $9,000 to $10,000 range,” he continued. “These trends were strongly consistent with the underlying shifts in auction availability.”
And as he always does, Webb gave an update on the rental-risk market where prices eased from record highs.
Manheim noted that auction prices for rental-risk units (unadjusted for mix and mileage) declined for the fourth consecutive month in August. The average price is now off approximately $1,200 from the all-time high reach in April, but down less than $300 from a year ago.
Webb mentioned the index of rental risk pricing that adjusts for changes in mix and mileage was down $1,610 from its March peak and is down $470 from a year ago.
“Volumes sold at auction remained low in August, and average mileage slipped back below 40,000,” Webb said. “With new-vehicle sales into rental up 10 percent in August, some increased flow back into the wholesale market is inevitable, whether it is via the traditional auction process or some other channel.”
Only 11 percent of the wholesale value adjustments last week were increases, according to Black Book, which indicated that this ratio has not been this small in nearly 11 months.
After recapping in-the-auction-lane comments from editors in his weekly video report, Black Book editorial director Ricky Beggs said: “The resulting analytical efforts and actual value adjustments ended up with the lowest percentage level of increasing adjustments at only 11 percent, since the 9 percent increases for the week ending Oct. 18, 2013.
“The big difference between the two periods was the number of actual vehicles adjusted at 2,146 per day last October and only 1,492 per day this past week, direct evidence showing lower bidding activity,” Beggs continued.
He also pointed out in the latest “Beggs on the Used Car Market” report that the week ending Oct. 18 saw greater price swings, with cars falling $74 and trucks off $64. This time around, cars fell $57 and trucks dipped $54.
Interestingly enough, this marked the smallest decline for cars in eight weeks but the largest change for trucks in six weeks.
While indicating that there wasn’t much of a market pattern to discern from this past week, Beggs did note that “the declining change level for the cars and the trucks has been greater this year.”
Offering some overall commentary on the market, Beggs talked about the positive impact that leasing has had on new-vehicle retail sales as well as the selection of used cars in the wholesale market.
The fact that lease penetration numbers are “continuing to prosper” had led to increased used-car supply, he said, “lowering the level of aggressive bidding as there are more desirable units to choose from.”
Beggs added: “Even though (last week) was a short week due to the Labor Day holiday, there was plenty of data to analyze. The feedback from the auction lanes through the Black Book survey reports gave us two primary type comments.
“One was a softer market with more no sales. The other still indicates the strong seasonal interest in trucks. As the editors attended various auctions, their on-the-lanes interpretation was also of more no sales, no specific pattern of buying activity, yet really good crowds in attendance,” he continued.
Breaking down the segment changes, the most stable car segments were entry-level cars (up $1 last week), entry midsize cars and compact cars (both down by $32). Beggs said he was a bit surprised by this, given how gas prices — albeit stable in the past week — are $0.15 lower than they were a year ago.
Elsewhere, another trend Beggs spotted was the consistency within the full-size van class.
“There is only one pretty consistent pattern within the market change over the past few weeks, and that is for the full-size vans, where the passenger versions continue to bring the money, with a $23 increase in average price week over week, and positive week-over-week changes for four of the past five weeks,” he said.
The complete video from Beggs and Black Book can be seen above.
As Auto Remarketing investigated an area where the impact of recalls might be more pronounced for its special National Auto Auction Association Convention issue, both Fitch Ratings and NADA Used Car Guide released analyses on Tuesday stating that the effects from the record-setting year of campaigns might be muted.
First when considering vehicles included in rental fleets, Fitch recapped much of the depreciation analysis produced by Black Book Lender Solutions. As previously reported by SubPrime Auto Finance News, Black Book’s newest white paper dissected four significant recalls, including:
— Toyota Camry (gas pedal/unintended acceleration issue on 2008 and 2009 models)
— Chevrolet Cobalt (key ignition/unintended shut off on 2005-2007 models)
— Ford Escape (engine fire risk on 2013 models)
— Ford Explorer (Bridgestone-Firestone tire recall on the 2000 model)
Fitch mentioned Black Book’s study acknowledged material declines in Toyota's reputation in brand surveys following its recalls, as well as slippage in Toyota's hold of new-vehicle sales between 2009 and 2010.
“Yet, monthly depreciation rates on the Camry never exceeded the blended depreciation rates on similar- model, similar-year cohorts,” Fitch said. “In the Ford and GM cases, the study compared the depreciation rates of both newer and older model years relative to the model years affected by the recalls.
“Data generally showed no acceleration in valuation declines for any of the model years in the six-month period following the recalls,” the firm continued.
Acknowledging that this year’s record amount of recalls has created material disruptions and driven up operating costs for rental companies, Fitch projected the recalls should not be a major threat to the residual values of the affected vehicles within rental fleets.
“Steady residual values could keep the pain of the recent recalls limited to the incremental service costs that have already crimped second-quarter earnings reported by firms such as Hertz Corp. and Avis Budget Group. Consequently, Fitch expects the impact to the rental car firms' overall credit profiles to be modest,” analysts said in light of approximately 37.5 million vehicles being recalled globally, well above the prior record of 30.8 million recorded in all of 2004.
Fitch emphasized that residual values are important factors to consider at the end of the vehicle life, when rental car firms seek to dispose of vehicles that are not returned to manufacturers (risk vehicles).
“Rental car firms currently hold high proportions of risk vehicles in their fleets to provide flexibility in managing fleet levels and to take advantage of the robust used car market in the U.S. through various vehicle disposition channels,” Fitch said.
“Regardless of recall activity, Fitch expects residual values to come under pressure through the end of 2014 as significantly higher vehicle supply is expected to enter the used-car market from vehicles coming off lease and trade-ins,” the firm continued.
Looking at the topic from another angle, Fitch’s auto asset-backed securities residual value index — which tracks the performance of residual values in ABS transactions — recorded a gain of 5.76 percent in July, down from a gain of 8.38 percent the prior month.
The index has recorded gains in each month going back to May 2009, but Fitch expects the index to move lower in the latter part of the year.
“Expectations of used-car market softness are further confirmed by Black Book's used car depreciation rates, which are expected to rise to 13.5 percent in 2014, up from 12.8 percent recorded in 2013, but remain below the historical average rate of approximately 15 percent,” said Fitch analysts, which pointed out that Black Book uses 2- to 6-year-old vehicles in its overall depreciation trend summaries for consistent comparisons.
NADA UCG Recall Impact Analysis
Meanwhile, the analysts at NADA Used Car Guide released their own white paper on Tuesday. The document titled, The Impact of Vehicle Recalls on the Automotive Market, examined many of the same high profile recalls like Black Book’s efforts did. Unlike GM’s high-profile ignition recall that was for older units no longer in production, NADA UCG noted that Toyota’s campaigns of five years ago included prominent vehicles likely in late-model inventory.
Before the recalls, NADA UCG calculated that used Toyota cars and trucks carried prices nearly 40 percent higher than those of direct competitors. This metric meant that for the average $10,000 vehicle, a comparable Toyota carried a premium of $4,000.
“But as the recalls unfolded and media scrutiny intensified, Toyota’s advantage over the competition quickly deteriorated,” NADA UCG analysts said. “By April 2010, five months after initiating the first recall, Toyota’s competitive advantage had shrunk to 20 percent.
“By late 2010, Toyota recovered some of the ground it had lost, but the automaker’s used vehicle prices still have not regained their former position of dominance,” they continued. “When the dust settled, Toyota’s price advantage over its competition stabilized at around 30 percent, an outcome that reduced the spread between its used prices and those of a $10,000 rival by a considerable $1,000.”
Nonetheless, NADA UCG insisted that the effect of recalls on automaker market performance is determined by a variety of factors.
“History has shown that, by and large, brand reputation only tarnishes when recalls are tied to numerous injuries or deaths and media attention is widespread,” analysts said.
“As we saw with Toyota, significant and lasting damage can occur when these conditions are combined with events perceived as decidedly out of character for a manufacturer,” they continued. “Automakers strive for a reputation synonymous with quality, but ironically they suffer more from a recall event if consumers already perceive them in this light. Evidence suggests that model age also influences recall impact, which could be because older models are less associated with a brand’s current product image.
“We can say with confidence that future recalls will have a measurable impact on market performance, but it’s a bit more difficult to pinpoint the exact degree,” NADA UCG went on to say. “GM’s recalls are a perfect example. The manufacturer’s new vehicle sales and used vehicle prices have gone relatively unscathed, even though circumstances surrounding its recalls are somewhat similar to what Toyota experienced a few years ago.
“Above all, this report shows that the same factors cause recall-related brand damage, but individual circumstances determine the severity of the damage,” analysts added.
More Coverage from Auto Remarketing
The latest commentaries from Fitch and NADA UCG are just the latest reports Auto Remarketing has related to recalls and their impact in the used-vehicle market.
Auto Remarketing reached out to several auction leaders to get a sense of how these recalled units are clogging up the remarketing process. Auction Broadcasting Co. president Jason Hockett shared some first-hand experiences as did Lynn Weaver, general manager of Harrisburg Auto Auction.
The stories will be shared in the Sept. 15 edition of Auto Remarketing, which also will be distributed during NAAA’s Convention in Boston beginning on Sept. 23.
If you’re not going to be in Beantown for the event, be sure to claim your free subscription by going here or review the digital edition at digital.autoremarketing.com.
As we wrapped up August in the lanes last week, prices continued to trend downward — creating an optimum buying environment at auction, said Black Book’s Ricky Beggs.
And it was a busy week at the auction, too, the Black Book editorial director said in his latest “Beggs on the Used Car Market” video report.
There were an average of 2,079 price adjustments for vehicles occurring each day, which marks the most price changes seen since the week ending Aug. 1, said Beggs.
The cars saw an average price drop of $81 this past week, a number which Beggs says is “pretty steady,” as the level of decline over the past six weeks sits at an average of $76.
But as last week’s auction action tended to lend itself to buyers, there were a few car segments that saw larger-than-average drops, with three segments touting over than $100 price decline.
The premium sporty cars fell by the largest dollar amount, dropping $127, or 0.29 percent.
But as Beggs pointed out last week, the smaller segments are seeing prices dip in the lanes, as well.
For example, the entry level cars saw the largest percentage drop last week, falling by 1.35 percent, or $92.
Trucks once again proved stronger in the lanes, notching the smallest average decline in segment prices over the past eight weeks with a drop of only 0.19 percent, or $29.
The compact SUVs showed strength in the lanes with a $3 price increase. The compact pickups are also performing well, with only a $4 drop last week.
Beggs also pointed out one “big swing in market movement” among the truck segments; the full-size SUVs only dropped $11 last week, after the previous two-week average was a downard movement of just over $103.
On the other hand, the luxury SUVs — similar to the majority of luxury segments — have been seeing larger auction price declines.
This segment saw a decline of $97 last week, according to Black Book data, continuing a five-week trend of large price drops.
As we move forward into fall, Beggs explained Black Book will be watching price movement in the lanes carefully as model years shift.
“The used market seems to making its move and this time of the year it is being driven for the late-model units due to another model year of vehicles coming into the market,” said Beggs. “Many of our survey personnel have pointed this out in their summary reports. As the editors have attended auctions this week, this is also a consistent comment. The positive side is that there is another model year coming so we will be seeing plenty of models with major changes, others with minor appearance or drive train changes and even a few totally new to the market.”
To view the latest “Beggs on the Used Car Market” report, see the video above.
September is kicking off with lower used-car prices than expected, perhaps, as August’s auction price declines far exceeded initial predictions — at least through half the month.
In a post on NADA’s Used Car & Truck Blog on Wednesday, NADA automotive analyst David Paris pointed out that used-vehicle depreciation for units up to 8 years in age had dropped by 3 percent by mid-August.
Paris pointed out this figure is much higher than what’s typically been recorded for the month, and looking back to the 2011-2013 period, the average August decline was in the range of 1.6 percent to 2.4 percent.
But what seems as unusual market movement can be explained easily, Paris says.
“For starters, we believe the market is still compensating for the unusually strong spring market that was caused by temporary factors (harsh winter conditions, influx of recalls),” Paris said. “The large chunk of the rental unit volume that was kept in service to address these factors has steadily been finding its way to the auction over the past few weeks.”
In fact, the amount of 2013 and 2014 model-year units in the lanes rose by 11 percent on a month-over-month basis in July.
“Given that rental supply at auction through July remained down by some 8–10 percent compared to last year, it’s likely that the growth observed in supply last month has carried over into August,” Paris wrote.
Besides expanding off-lease supply, the new-car market is also serving to push used prices down, flooding the market with trade-ins.
“New-vehicle sales have thrived through the spring and summer months, sparked by an improving economy and strong incentives which have ultimately helped draw more consumers into dealer showrooms and in turn increased the number of vehicles being traded in,” said Paris.
On top of that, manufacturers are ramping up incentives to bring more shoppers in the new-car showroom, as well.
According to NADA, as of the end of August, total incentive spending was at its highest level since 2010.
Not surprisingly, the segments that are seeing some of the biggest drops are ones with some of the biggest incentives spikes on the new side.
Paris offered the following examples:
Manufactures had spent an average of $1,436 in subcompact car incentives as of late August, which is 32 percent more than they did in 2013, according to NADA data.
Furthermore, midsize ($2,817) and compact cars ($1,823) have both increased incentive spending by 21 percent compared to 2013, Paris reported.
Corresponding to the incentive spikes, subcompact, compact and midsize cars are seeing some of the largest price declines, with prices dropping by 3.7 percent, 3.3 percent and 2.9 percent, respectively, as of Aug. 23.
Trucks and SUVs continue to see stronger price retention than their smaller counterparts, picking up the smallest price losses this past month.
Large pickup prices has fallen in price by only 1.4 percent by Aug. 23, while large SUVs saw a slightly larger drop of 2.3 percent.